














How Do We Reduce or Recover Our Wastewater?
October 6, 2026
A review of the existing system, its pretreatment, and a retrospective design.
By Wayne Shub, CEO, BHF Technologies
How can we reduce or recover our wastewater? It is one of the most common questions we hear, and it usually comes with an equipment idea attached: what can we add to the end of the plant to reclaim the reject stream?
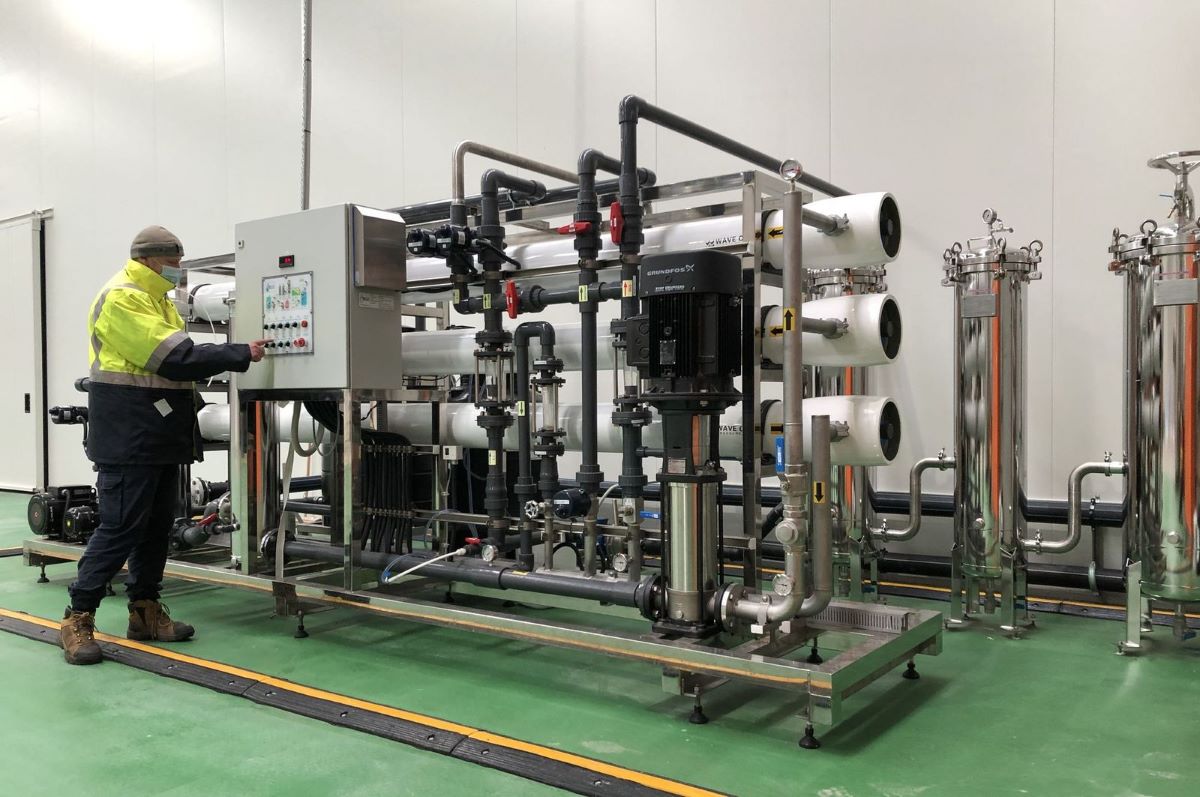
Recovery is simply the share of incoming water that ends up as purified water, with the rest going to drain. Adding equipment is rarely the right first step to improve it. The better starting point is to check whether the existing plant is running the way it was designed to. More often than not, the extra recovery is already there, held back by how the plant is set up rather than by what is installed. A recent project on a production laboratory’s purified water system shows this clearly, and we follow it through this article.
Start with the plant you have
Before saying a plant can increase recovery, we first need to show that its existing components can run at their best. That starts with three questions:
- What are the current flow dynamics, and is the plant configured the way it was designed?
- Is recovery limited by chemistry, by over-recovery, or simply by not enough flow for reliable RO operation?
- Is the pretreatment matched to this feedwater, or designed for a generic one?
Flow dynamics come first
To answer the first question, we audited the plant and measured its baseline flows and pressures as it actually ran. We then applied design principles to the same plant to work out what the correct baseline should have been.
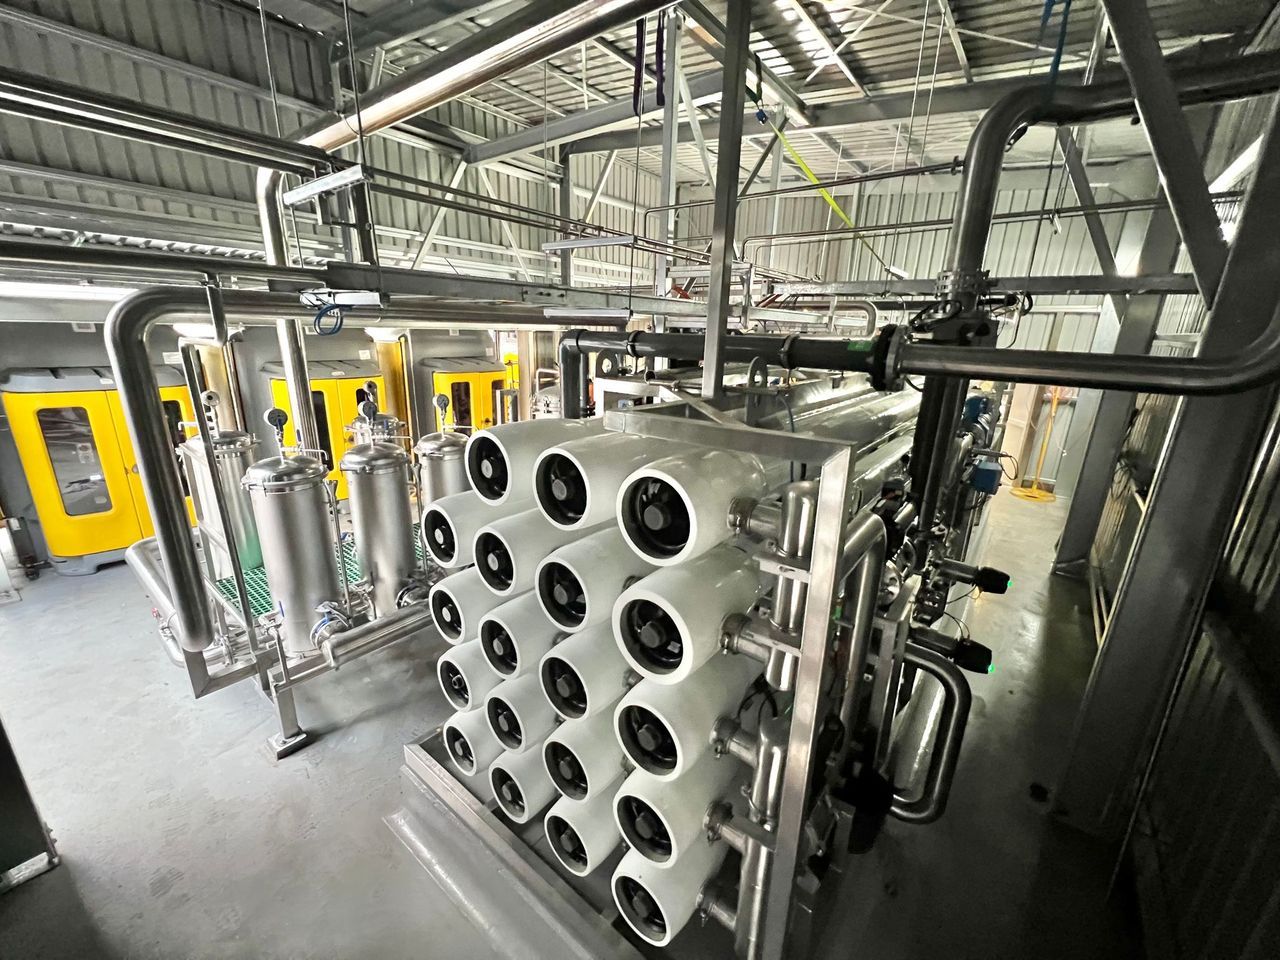
The comparison showed that flow to the RO membranes was well below design, the result of several changes made since commissioning. No single change was clearly wrong, but together they had starved the membranes of crossflow, the steady sweep of water across the membrane surface that keeps it from fouling.
This was the finding that reframed the project. On this plant, membrane fouling was caused first by incorrect flow dynamics, not just by feedwater quality. Low crossflow and over-recovery foul membranes no matter what is in the water, and no amount of upstream filtration can fix a flow problem.
Minor pipework changes brought the plant back to its correct design flows. This removed the self-inflicted fouling and showed the plant could achieve far more than its 60% total plant recovery, without buying any new equipment. The next question was whether the pretreatment could sustain it.
Then check that the pretreatment can sustain it
With the flows rebalanced, everything upstream has to work harder. The pretreatment, which prepares the water before it reaches the RO, must be able to keep up. The best place to start is the feedwater itself: what the pretreatment has to deal with, and what we can reasonably expect from it.
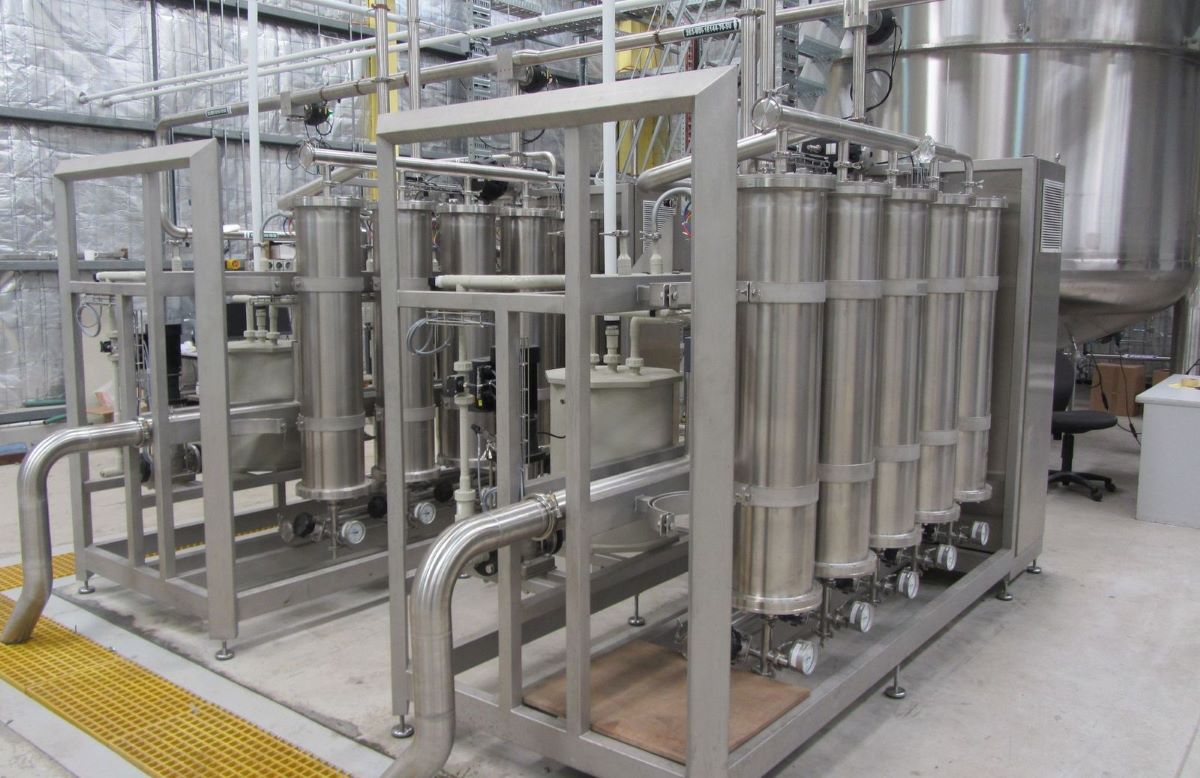
This site is fed by a Victorian surface water supply. Its existing pretreatment was an off-the-shelf stainless steel package made up of:
- A multimedia filter for dirt.
- Carbon vessels for chlorine.
- Softeners for hardness.
The feedwater conditions are summarised below.
| Feedwater condition | This site |
| Supply | Victorian surface water |
| Colloidal content | Very high |
| Chlorine | Relatively low |
| Hardness | Low, at around 15 ppm |
In principle, all three functions are needed. The real question is whether these components actually deliver them on this water, so we looked at each one in turn.
What the dirt actually is
We started with the multimedia filter, which removes particles down to about 40 µm. On this feedwater, less than 1% of the solids fall in that range. More than 99% of the dirt, at very high concentration, is smaller than 1 µm.
These fine particles, known as colloids, are a mix of organic and inorganic material. They are what makes it hard for an RO to meet its required fouling index, which is a measure of how likely the water is to block a membrane. The silt density index (SDI) is the standard test. It measures how fast water blocks a 0.45 µm filter disc over 15 minutes, and RO membranes generally need a result below 5.
On this supply, the disc was 75% blocked after 5 minutes and the test had to be stopped, well short of the 15 minutes the standard method needs. Put simply, the water is so heavily loaded that the industry’s standard test cannot be completed, yet it looks perfectly clear in a glass.
The 5 µm cartridge filters usually fitted downstream also do little against sub-micron colloids. That leaves the plant with a poor choice:
- Replace 5 µm or 1 µm cartridges at a high rate.
- Put up with more RO membrane blockage and more frequent membrane replacement.
The multimedia filter itself may look like a solid piece of equipment, built in stainless steel. On this duty, though, it does little to protect the RO, and it still needs maintenance, servicing and regular backwashing. That backwashing wastes the very water the site was trying to save.
Carbon vessels as a source of biofilm
The carbon vessels were next. Their pipework restricted flow, so they could not supply the minimum feed flow the optimised RO needed.
Removing chlorine is still necessary, because free chlorine oxidises and damages RO membranes. The problem is using conventional carbon to do it. A carbon vessel that sits idle or runs at low flow lets organics build up and bacteria grow in the bed. That growth moves downstream to the softener and RO membranes, and the carbon also produces a lot of backwash waste.
A better option is low-flow chemical dosing of sodium bisulphite (SBS) to neutralise free chlorine. This has two benefits:
- Removing the carbon bed also removes the microbial fouling that grows in it.
- There is no backwash waste to deal with at all.
Softening when there is little to soften
The softeners had the same flow problem as the carbon vessels. They were also heavily contaminated, most visibly in the brine tank, where biofilm and deposits had built up. The brine tank is filled with town water, which carries its own organic colloids. That means the tank is constantly fed nutrients, sits stagnant most of the time, and then empties into the resin bed at every regeneration, reinoculating the softener each cycle.
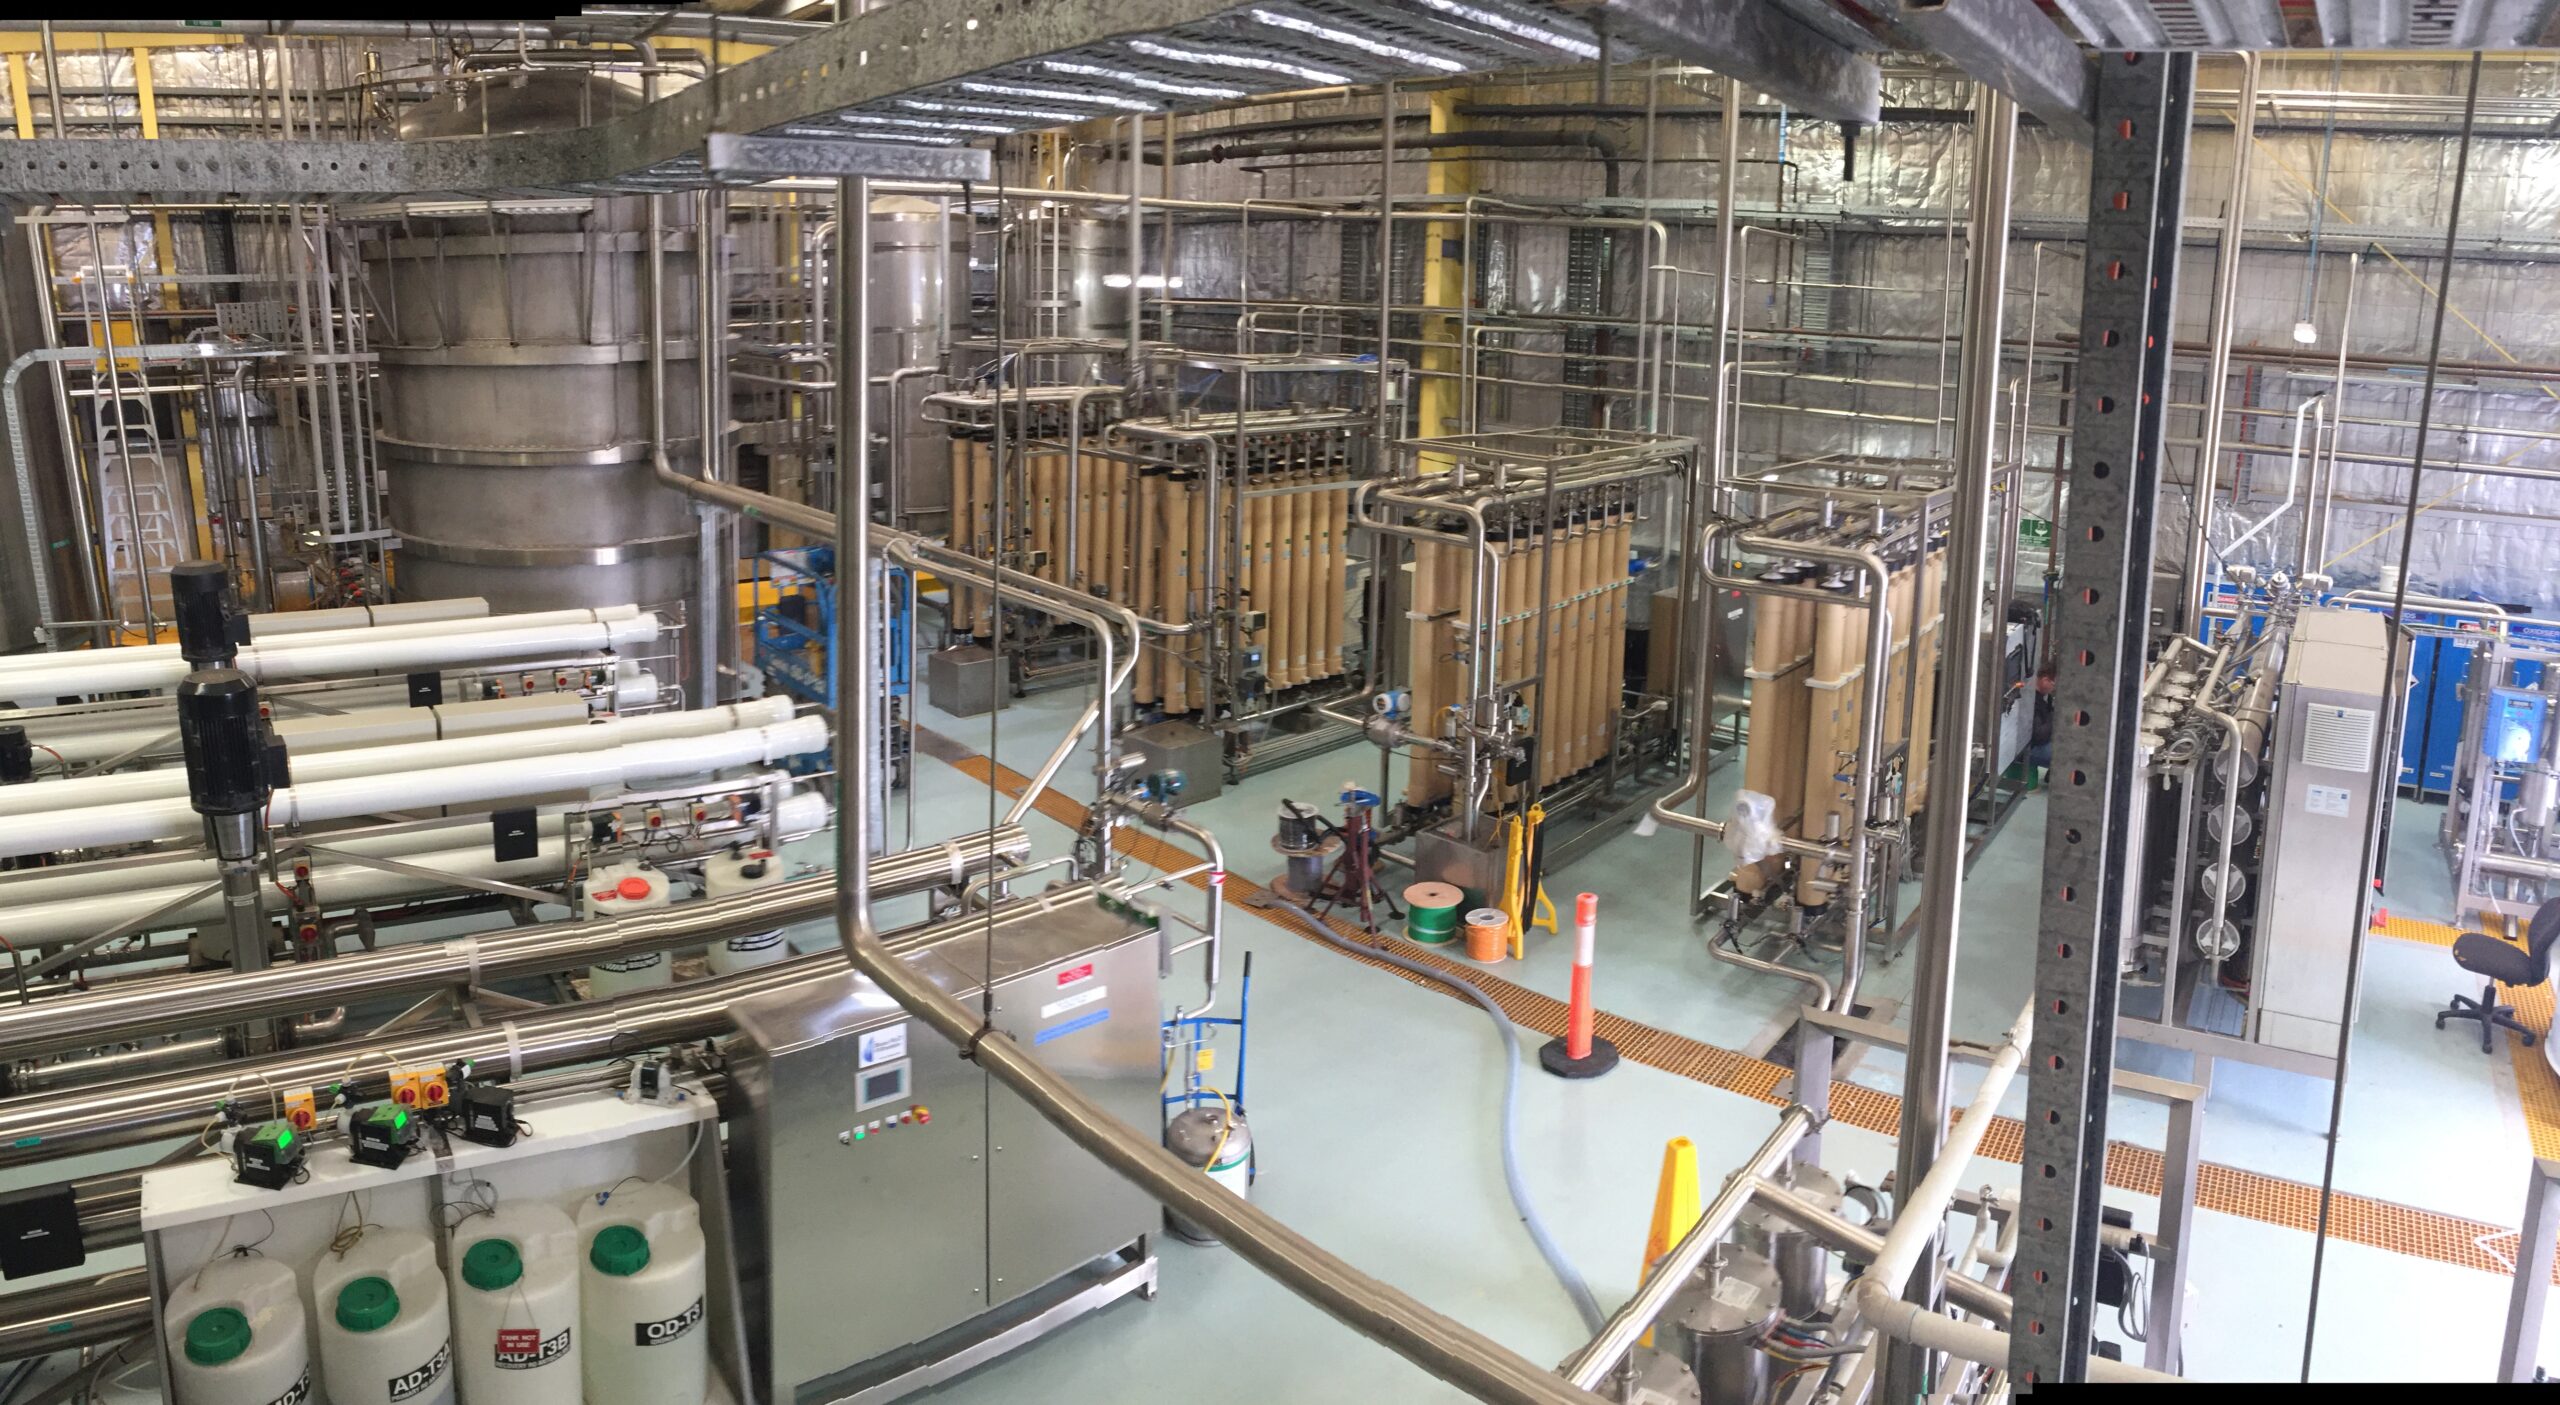
More importantly, at around 15 ppm hardness, this water does not need softening. Softening is not wrong in principle, but on this water a low dose of antiscalant, a chemical that helps prevent scale forming on the membranes, fully controls scale. BHF has several reference systems on this type of water. The most notable is at a biotechnology facility in Melbourne, where four large independent systems all run at 90% recovery behind ultrafiltration, none with a softener.
The Summary was uncomfortable
| Component | Intended function | Finding |
| Multimedia filter | Particulate removal | Largely ineffective here; less than 1% of the load is within its range |
| Activated carbon | Dechlorination | Undersized; promotes biofilm growth and fouls the downstream softener and RO |
| Softener | Hardness removal | Undersized for the required feed flow, with heavy biofilm in the brine tank; not needed on this water |
Three components, all maintained in good faith, yet none of them justifying its place in the plant.
The Alternative
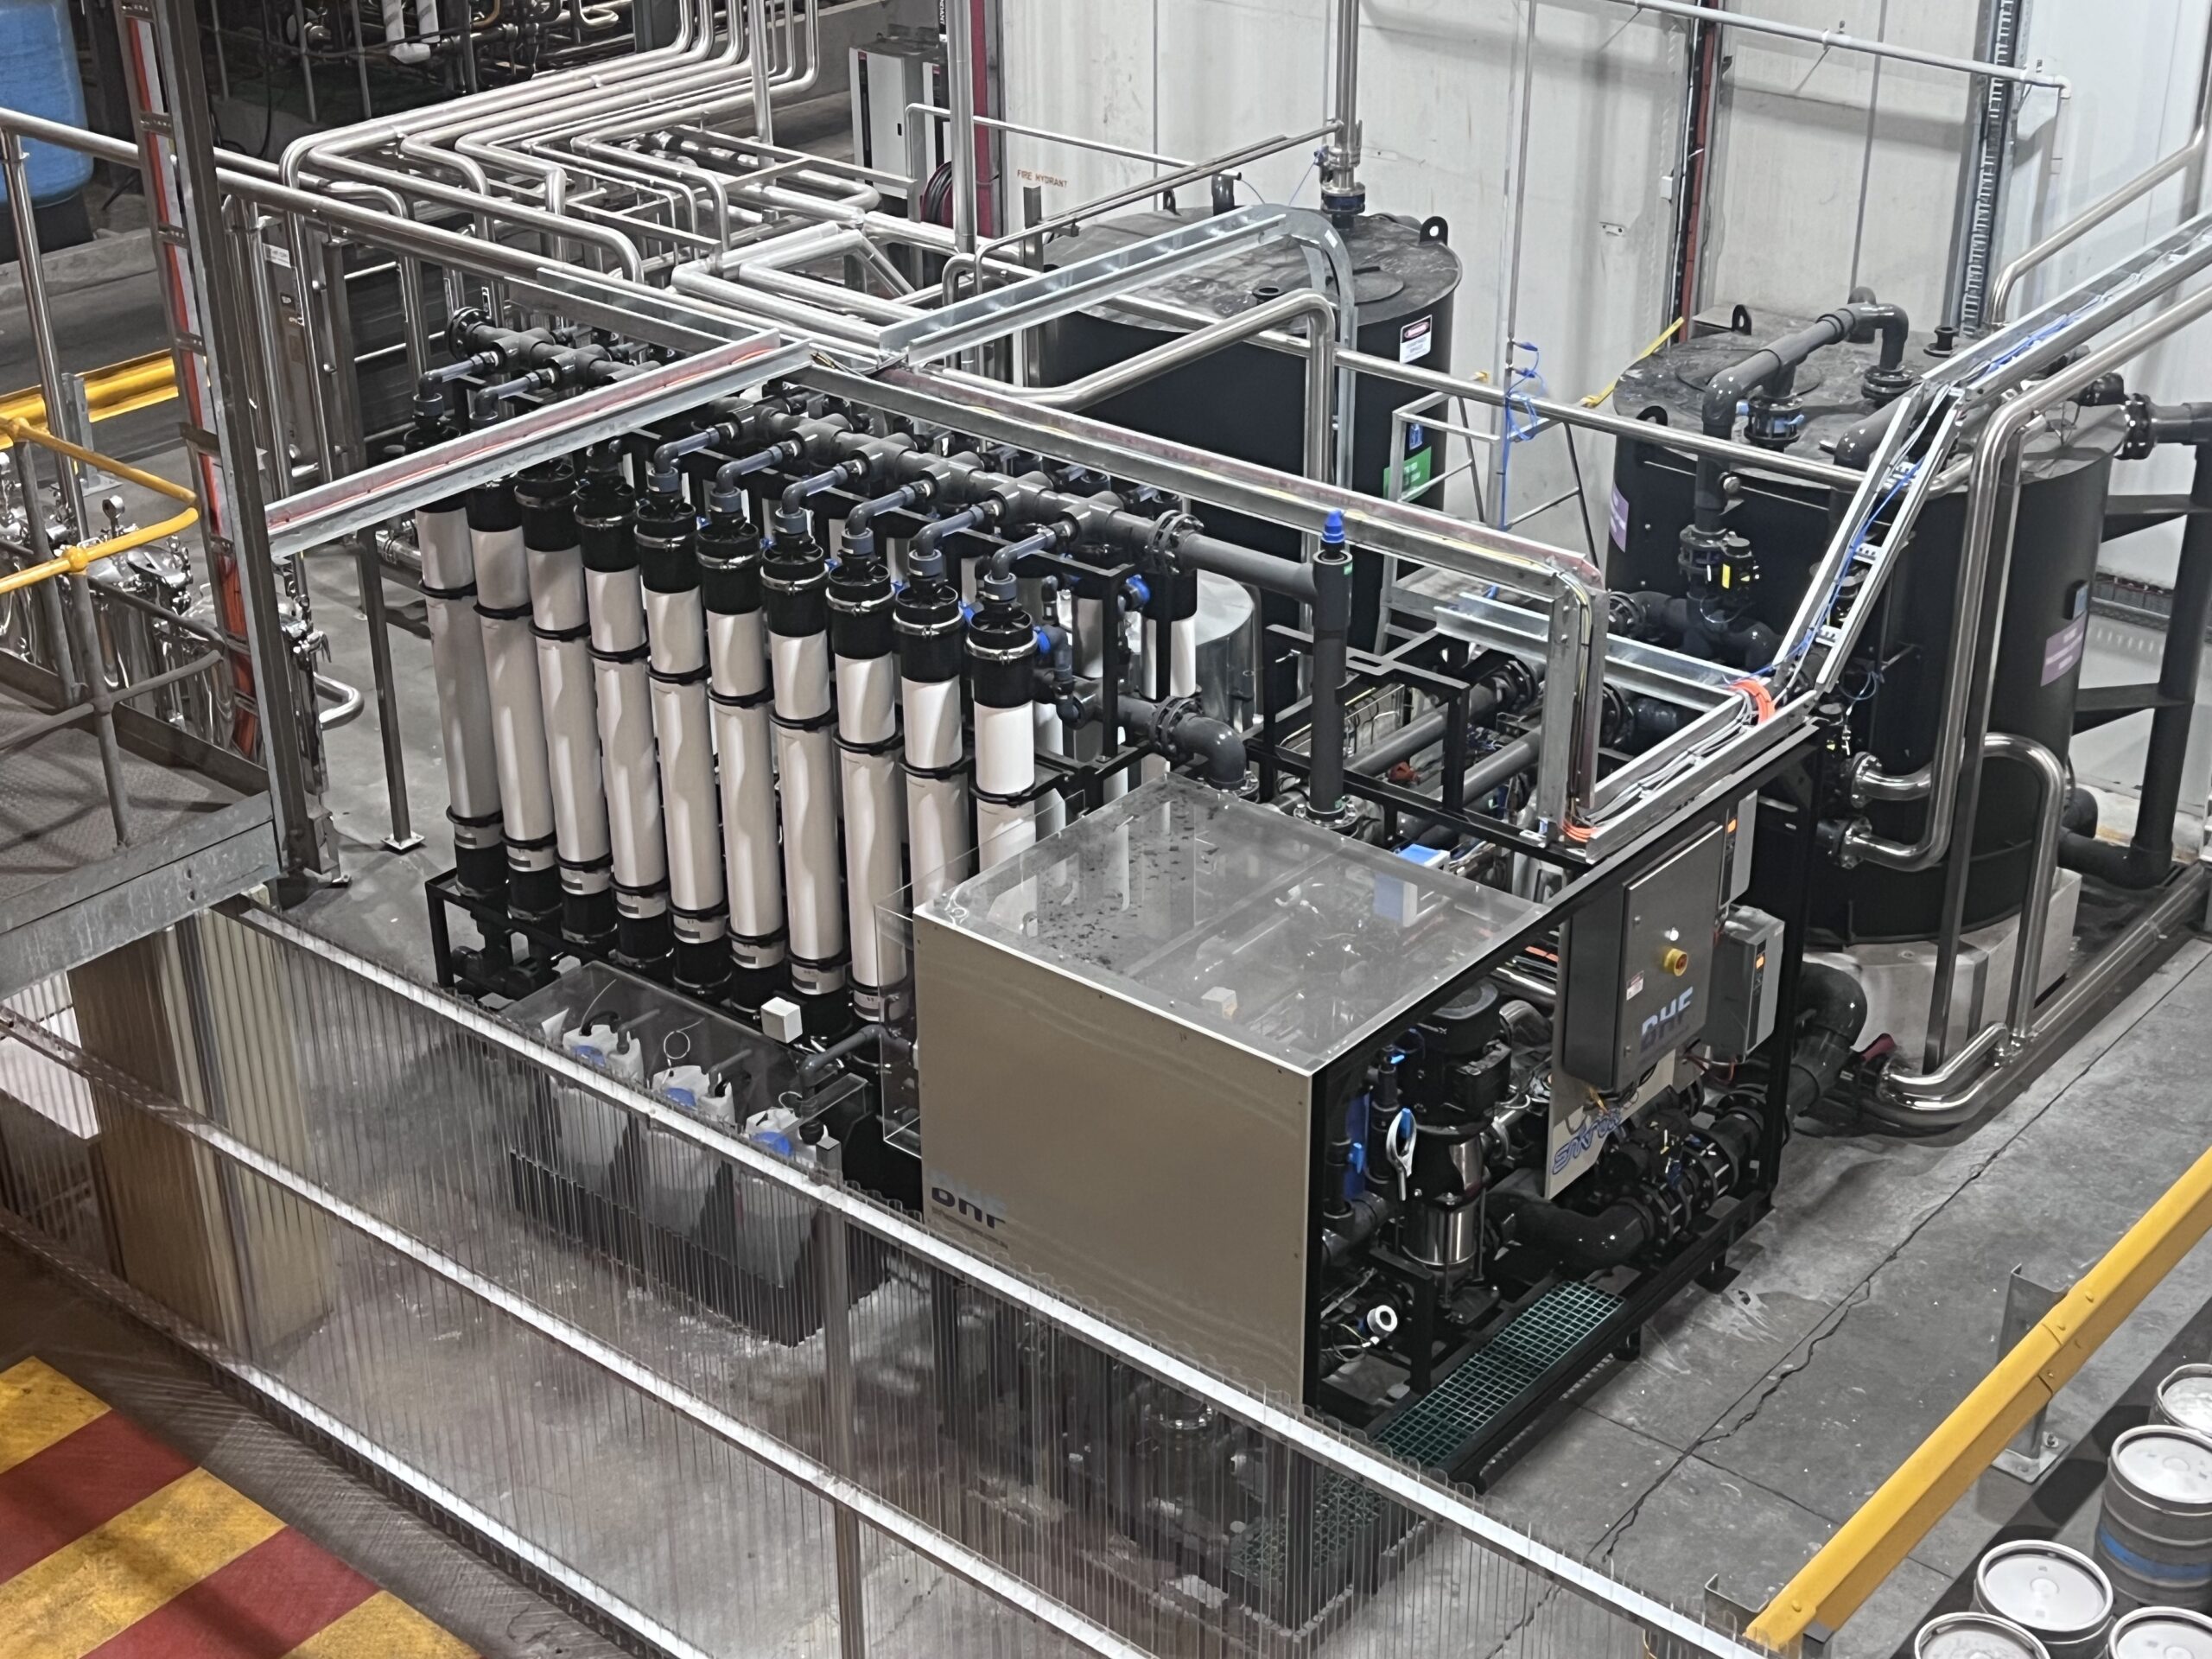
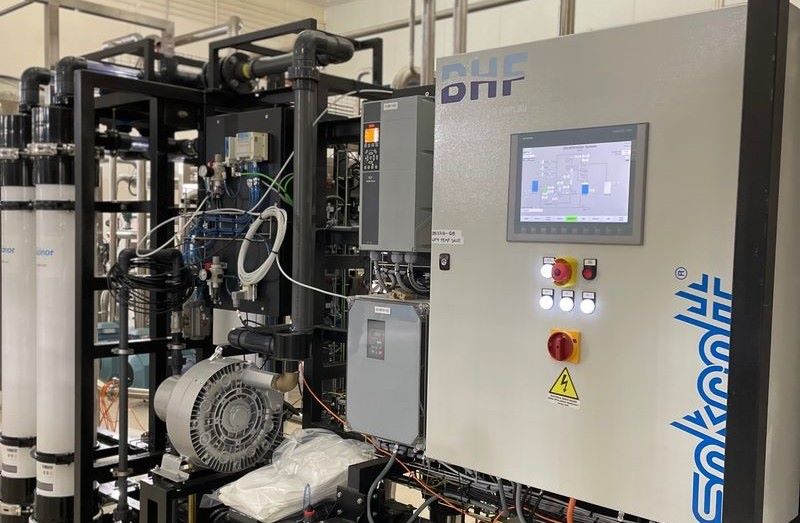
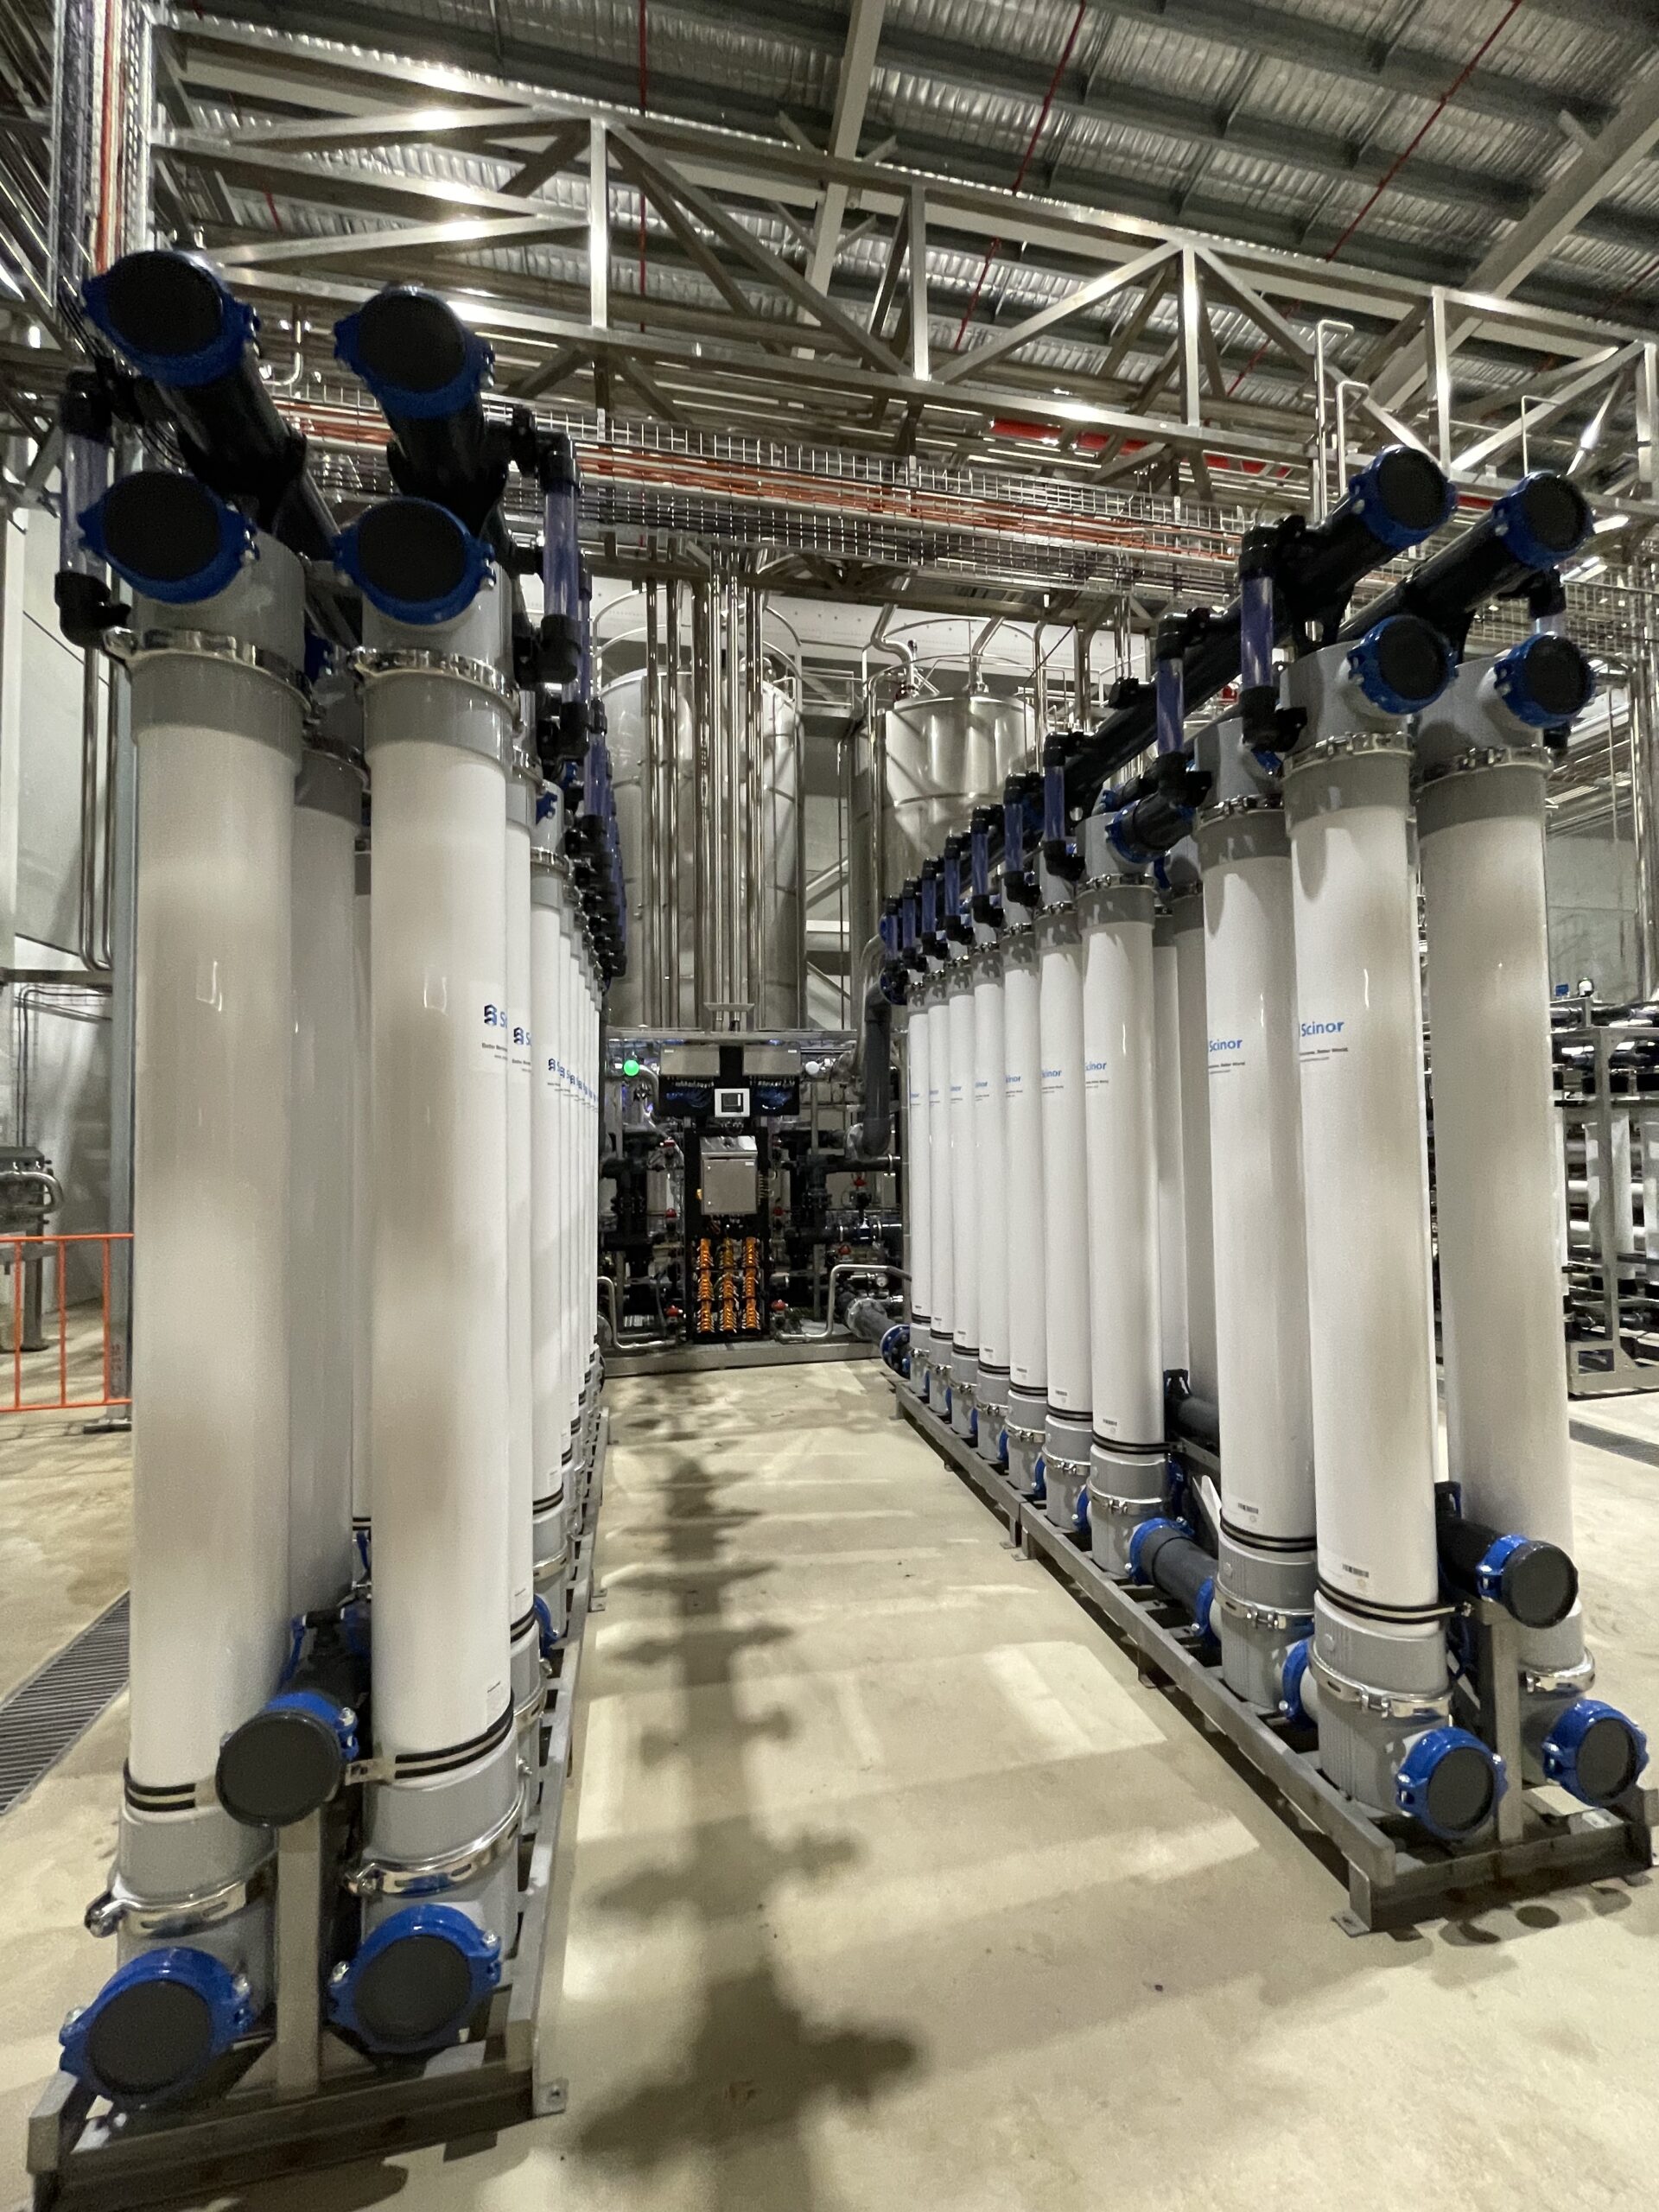
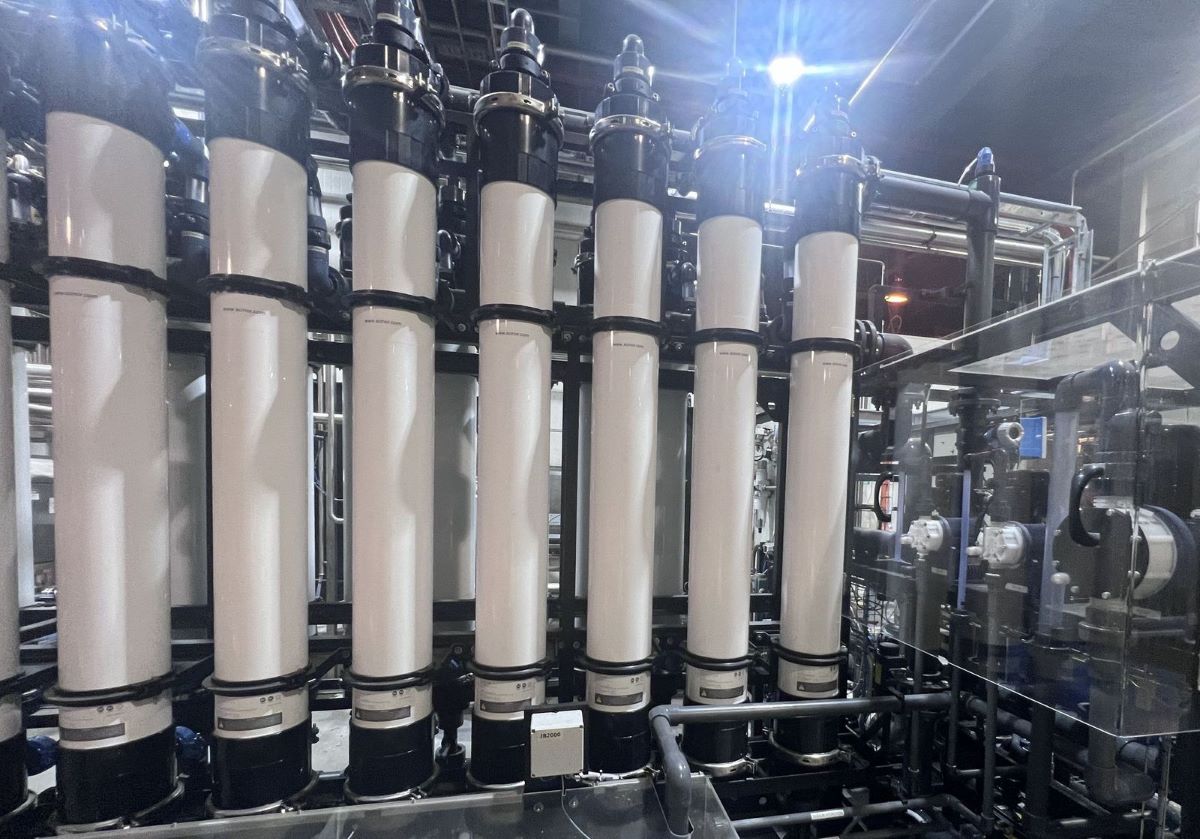
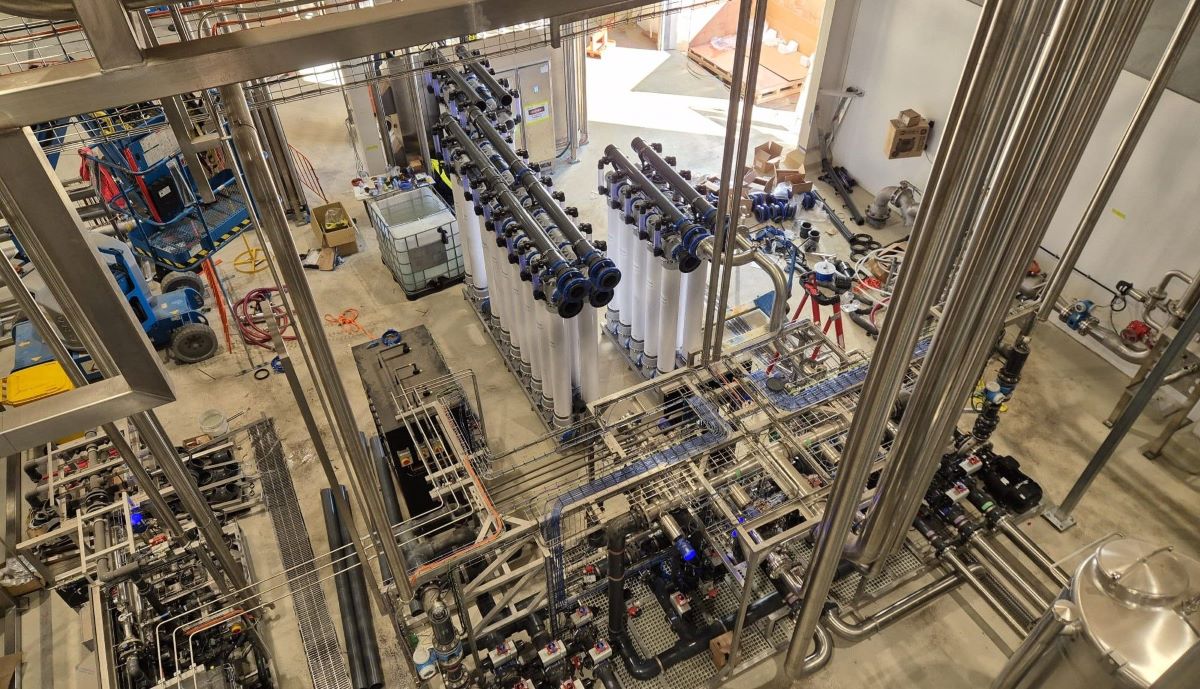
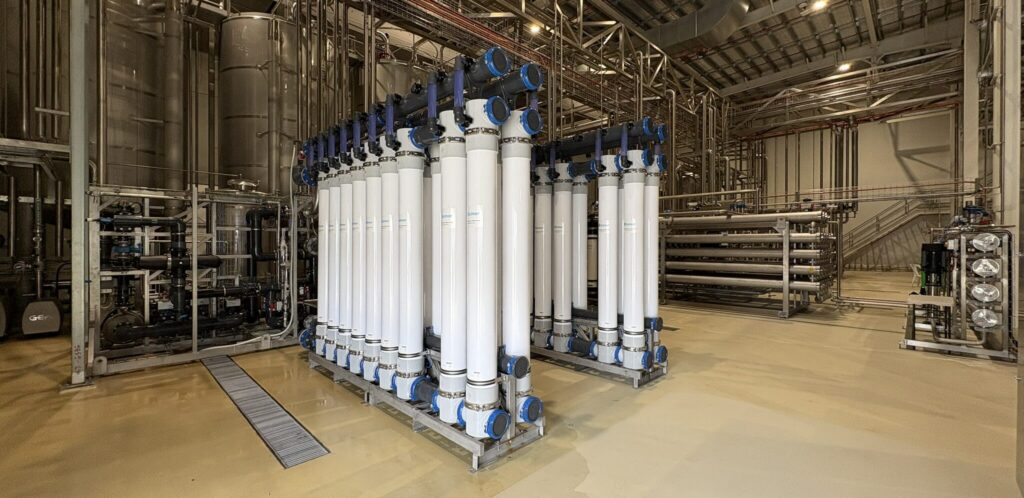
Based on those findings, and without going into detailed design, the cost-effective solution over three to five years is an ultrafiltration membrane system feeding a two-stage dosing skid:
- SBS for free chlorine.
- Antiscalant for scale.
This gives the RO a reliable, well-pretreated feed, so it can consistently produce its 1 µS/cm permeate with low service and cleaning costs and long membrane life.
This single setup replaces all three of the existing components.
Where the dosing goes matters as much as what it is
Dose the bisulphite just before the RO, not at the front of the plant.
In this setup, the chlorine already in the supply is left to do a useful job. Kept in the water through the ultrafiltration (UF) stage, it keeps the UF membranes clean and protects them from biofouling. It also keeps controlling biological growth in every metre of pipework up to the dosing point, so there is nowhere along the line for biofilm to take hold.
A carbon-first setup does the opposite. It removes the chlorine at the front of the plant and leaves everything downstream unprotected. That is exactly how the softeners on this plant became contaminated.
We will leave the detailed design of the dosing assemblies for another discussion. In short, they use very little of either chemical, so running costs are low, and they avoid the problems of carbon and softening vessels. The biggest of these is low flow that starves and fouls the RO, which no amount of vessel servicing will fix. Ultrafiltration is what makes this approach work on this water, and there are four reasons why.
Why ultrafiltration
- It filters what is actually there. UF removes particles down to about 0.03 µm. That captures the sub-micron colloids that make up this feedwater’s fouling load, which nothing in the existing system dealt with.
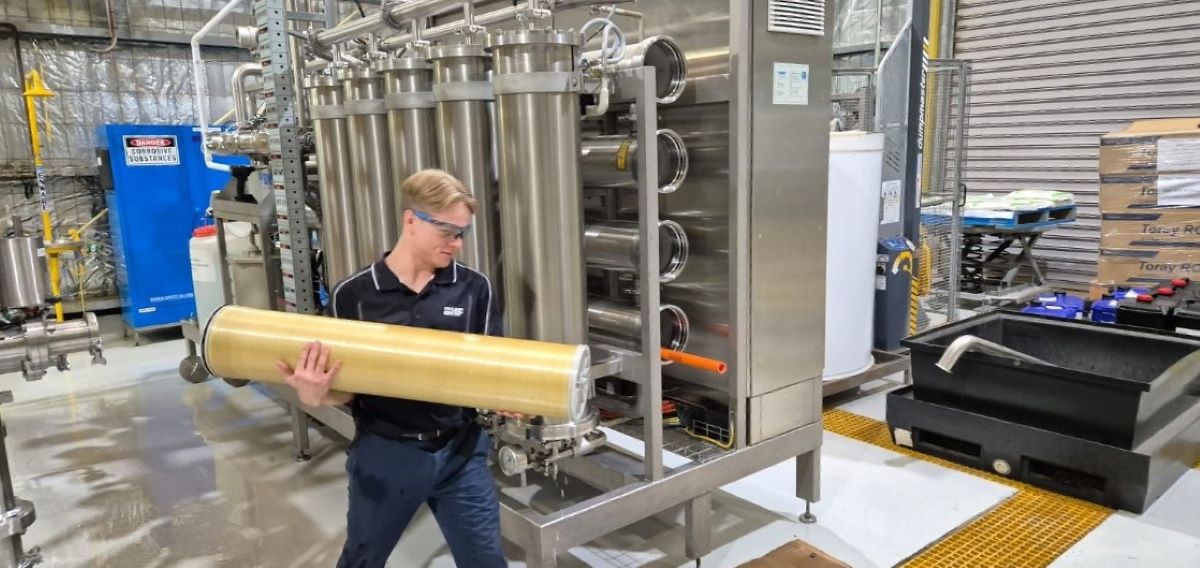
- It is not a consumable. The membranes clean automatically and last up to 10 years. The ongoing cost of fine cartridge filtration is largely removed, and running costs over the life of the plant are very low.
- It removes the food supply. Its tight membrane removes much of the colloidal organic load. These organics feed microbial growth in the system, which fouls RO membranes and, in hygienic or sterilising-grade applications, can put the purified water specification at risk.
- Its own waste is more than offset. UF wastes around 5% of its feed, but it allows up to 90% RO recovery, which is well worth the water it uses.
What the feedwater to the RO becomes
| Parameter | Before | After |
| Fouling index | 75% blockage in 5 minutes | SDI < 1 |
| Free chlorine | Present | < 0.1 ppm |
| Scale control | Softening: undersized, contaminated | Antiscalant dosing, full scale control |
| Colloidal and organic load | Very high, >99% sub-micron | Removed to ~0.03 µm |
And what that should deliver
| Measure | As found | After |
| RO output | Baseline | +30% |
| Total plant recovery | 60% | 85 to 90% |
| Cleaning and service interval | Monthly | 3-monthly |
| RO prefilter change | 2-weekly | 6-monthly |
| RO membrane life | ~1 year | Up to 5 years |
| UF membrane life | n/a | Up to 10 years |
| Permeate | Variable | ≤1 µS/cm, tight microbiological specification |
Projected for this plant from measured performance on similar systems. Recovery is a total plant figure and already includes the UF waste stream. On top of this, the backwash and regeneration water once lost from the multimedia, carbon and softening systems is saved by removing those components.
Looked at another way, for every 100 litres of purified water, the amount sent to drain falls from 67 litres to between 11 and 18 litres. That is roughly three quarters to five sixths less wastewater, even before counting the backwash savings above.
| Total plant recovery | Purified water made | Discharged to drain |
| 60% (as found) | 100 litres | 67 litres |
| 85 to 90% (after) | 100 litres | 11 to 18 litres |
Is it worth it?
The honest answer is that the flow correction cost very little, and the benefits were immediate. Replacing the pretreatment is a capital decision, and it pays back over three to five years through:
- Lower consumable, labour and wastewater costs.
- Longer membrane life.
- A plant that consistently meets its specification instead of sometimes missing it. This is often the biggest benefit, and the hardest to measure.
For comparison, RO membranes on this water without the right pretreatment usually last about one year. The five-year figure is based on what the Melbourne reference systems described earlier have actually achieved. Nor are the conditions that held this plant back unique to it.
If this sounds like your plant
- Surface water supply with high colloidal or organic content.
- An off-the-shelf pretreatment package designed for generic water, not yours.
- Low feed hardness, but a softener still being run and maintained.
- A plant modified since commissioning, where flows have drifted from design.
- High cartridge filter consumption and short membrane life, accepted as normal.
None of these signs proves anything on its own. Together, though, they usually point to recovery the plant already has but nobody has gone looking for. Finding it starts with understanding how the plant is actually running.
The Takeaway
Reducing wastewater does not always start with new equipment. On this plant, correcting the flows cost very little and showed the RO could do far more than its 60% recovery. Matching the pretreatment to the water, with ultrafiltration and chemical dosing replacing three components that did not suit it, is projected to lift total plant recovery to 85 to 90%, cut the water sent to drain by up to five sixths and extend membrane life.
As on most plants, the first step is the same: before adding to the plant, make sure what is already there is working as it should.
Talk to our team
The simplest way to find out is a water plant audit. It measures your baseline flows and pressures, compares them with the design, and shows what your plant can actually do before any equipment is quoted. To arrange one, contact our team through our enquiry form.
Frequently Asked Questions
Not as a first step. On the plant in this article, minor pipework changes that brought flows back to design removed the self-inflicted fouling and showed the plant could achieve far more than its 60% total plant recovery, without buying new equipment. The next step is to check that the pretreatment can sustain it.
Not necessarily. On the water in this article, at around 15 ppm hardness, softening is not needed. A low dose of antiscalant fully controls scale, and BHF’s reference systems on this type of water run at 90% recovery behind ultrafiltration with no softener.
Yes, around 5%, but it allows up to 90% RO recovery. The projected 85 to 90% total plant recovery already includes the UF waste, and the backwash and regeneration waste from the multimedia, carbon and softening systems disappears when those components are removed.