














How Do We Reduce or Recover Our Wastewater?
October 6, 2026
A review of the existing system, its pretreatment, and a retrospective design.
By Wayne Shub, CEO, BHF Technologies
The enquiry
It is one of the most common questions we are asked: how can we reduce or recover our wastewater? It usually arrives as a question about equipment: what could we add to the back of the plant to reclaim the reject?
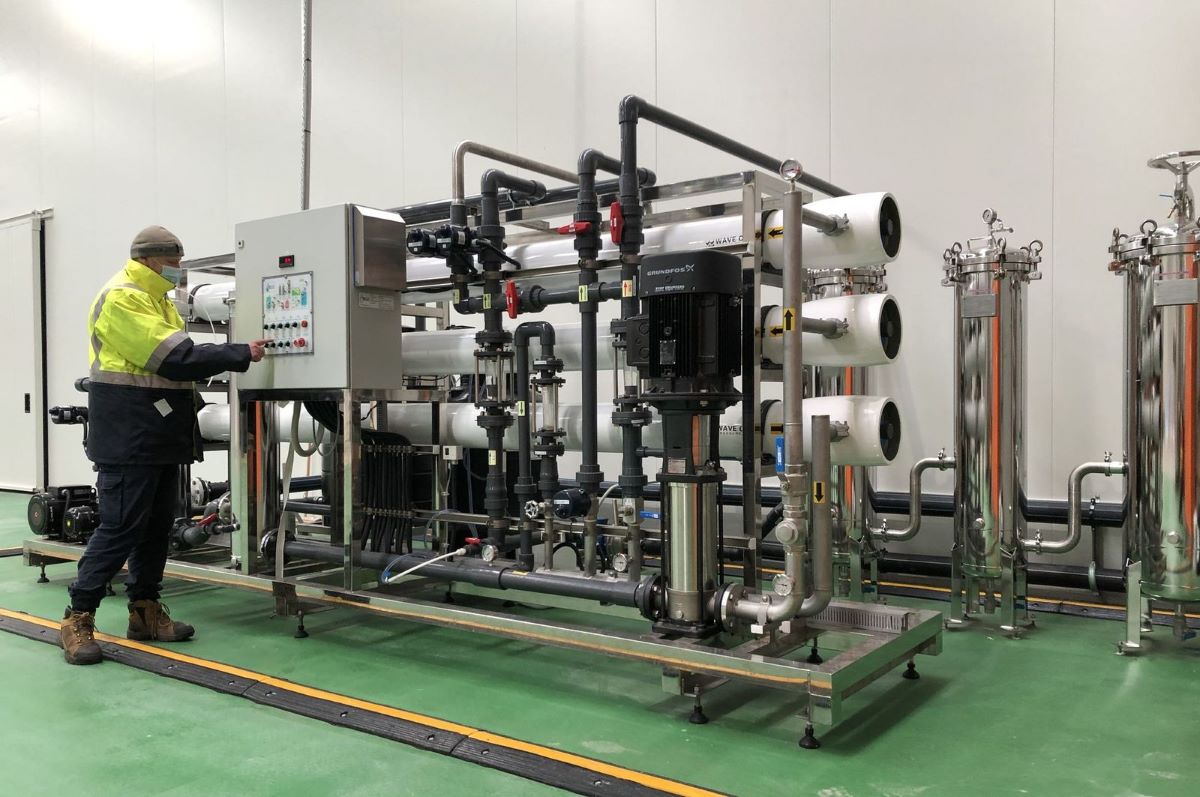
On most plants, that is the wrong place to start. The recovery a plant is capable of is usually already sitting inside it, held back by how it is configured rather than by what it contains. A recent job on a production laboratory’s purified water system makes the point well.
Start with the plant you have
Before any claim can be made about a plant’s ability to increase recovery, its existing components have to be shown capable of running at their own optimum. That means asking a narrow set of questions first:
- What are the current flow dynamics, and is the plant configured the way it was designed?
- Is recovery being limited by chemistry, by over-recovery, or simply by insufficient flow to sustain reliable RO operation?
- Is the pretreatment matched to this feedwater, or to a generic one?
Flow dynamics come first
A plant audit established the baseline flows and pressures as the system actually ran, and design principles were then applied retrospectively to the same plant to establish what the correct baseline should have been.
The comparison showed significantly undersized flow to the RO membranes, the accumulated result of various modifications made since commissioning. No single change had been obviously wrong. Together they had starved the membranes of crossflow.
The finding that reframed the job
| On this plant, membrane fouling was in the first instance a consequence of incorrect flow dynamics, not of feedwater quality alone. Insufficient crossflow and over-recovery foul membranes independently of what is in the water, and no amount of upstream filtration fixes a flow problem. |
Minor pipework modifications rebalanced the plant to its correct design flows. That removed the fouling the plant was inflicting on itself, and showed it was capable of far more than the 60% total recovery it had been running, without a single item of new plant being purchased. Sustaining that capability was a question for the pretreatment.
Then check that the pretreatment can sustain it
Rebalanced flows raise the duty on everything upstream, so the pretreatment has to be in place and operational to suit the optimised RO. It is useful to look first at the feedwater conditions, so we know what the pretreatment is dealing with and what performance we should expect of it.
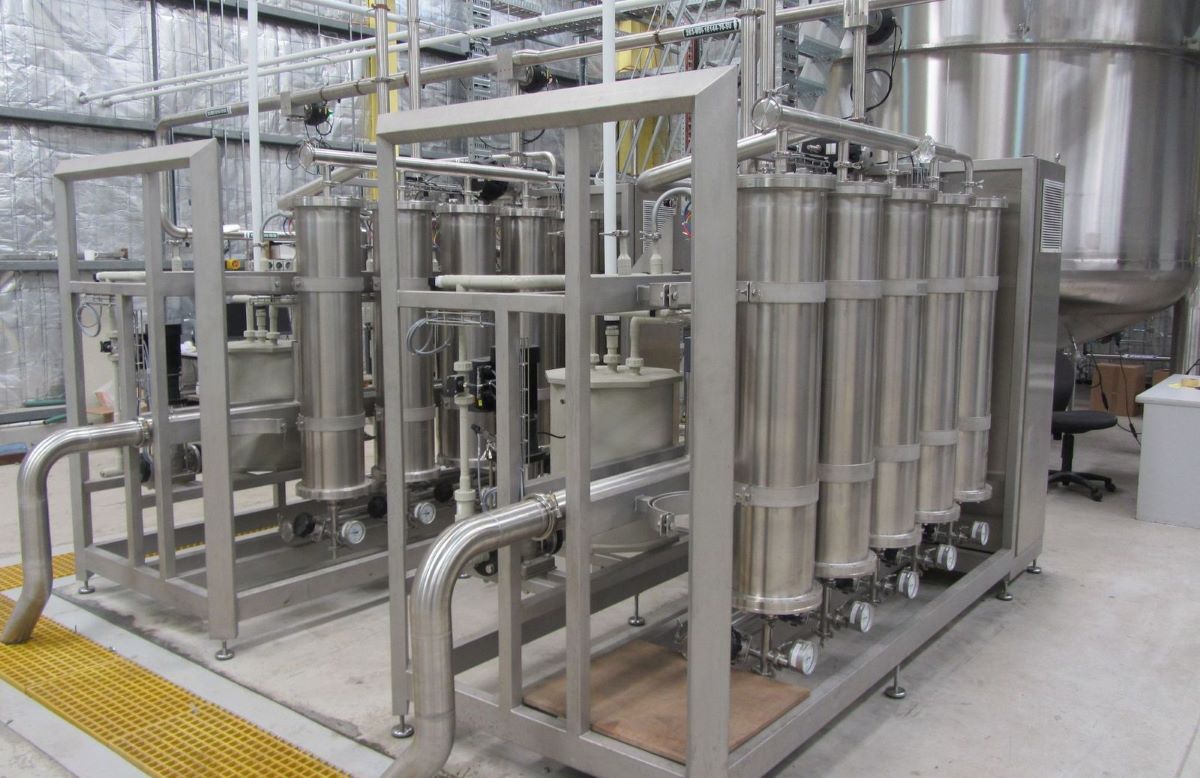
This site runs on a Victorian surface water supply: very high colloidal content, relatively low chlorine, and low hardness at around 15 ppm. The existing pretreatment was an off-the-shelf package: stainless multimedia filter for dirt, stainless carbon vessels for chlorine, stainless softeners for hardness.
| Feedwater condition | This site |
| Supply | Victorian surface water |
| Colloidal content | Very high |
| Chlorine | Relatively low |
| Hardness | Low, at around 15 ppm |
All three functions are required in principle. The question is whether those particular components perform them on this particular water.
What the dirt actually is
A multimedia filter removes particulate down to roughly 40 µm. On this feedwater, less than 1% of the solids load sits in that range. More than 99% of the dirt, at very high concentration, exists below one micron.
Those very fine colloids are a mixed organic and inorganic population, and they are exactly what challenges an RO’s ability to meet its required fouling index. The silt density index measures the rate at which water blocks a 0.45 µm filter disc over 15 minutes, and RO membranes generally require a result below 5.
On this supply the disc reached 75% blockage in five minutes and the test was terminated there. The standard method needs fifteen. It is worth sitting with that for a moment: the water is so heavily loaded that the industry’s standard cleanliness test cannot be completed on it, and it still looks perfectly clear in a glass.
The 5 µm cartridge filters usually fitted downstream are also largely ineffective against sub-micron colloids. So the plant is left with a poor choice: consume cartridges at a high rate at 5 µm or 1 µm, or accept a higher rate of RO membrane blockage and replace membranes more often.
| In stainless steel a multimedia filter looks like serious plant. On this duty it offers little protection to the RO, while still requiring upkeep, servicing and regular backwashing, which is itself a source of the water waste the customer wanted to reduce. |
The biofilm you paid for
The carbon vessels were served by pipework that limited flow, so the installed capacity could not meet the minimum feed flow the optimised RO required.
Dechlorination itself is necessary, as free chlorine oxidises RO membranes. The difficulty is conventional carbon in this service. A vessel held static, or run at low flow, harbours organic concentration and bacterial growth within the bed. That growth migrates downstream to the softener and the RO membranes, and the carbon produces high backwash waste as well.
The alternative is low-flow chemical dosing of sodium bisulphite to neutralise free chlorine. Two things follow: the microbial fouling in the bed goes away with the bed, and the backwash waste is eliminated rather than treated.
Where the dosing goes matters as much as what it is
| Dose the bisulphite immediately ahead of the RO, not at the front of the plant. Chlorine arriving in the supply is doing useful work. Left in solution through the ultrafiltration stage it keeps the UF membranes clean and protects them from biofouling, and it goes on suppressing biological growth through every metre of pipework right up to the dosing point. There is no length of the train where biofilm gets an opportunity to establish. A carbon-first arrangement does the reverse: it strips the chlorine out at the front and leaves everything after it unprotected. That is precisely how the softeners on this plant became contaminated. |
Softening when there is little to soften
The softeners showed the same flow limitation as the carbon. They were also heavily contaminated, most visibly in the brine tank, where biofilm and accumulated muck had established. The brine tank is made up on town water, which carries its own organic colloids, so it is fed a nutrient supply, sits largely static, and then discharges into the resin bed at every regeneration. A softener regenerated from a contaminated brine tank reinoculates itself on a cycle.
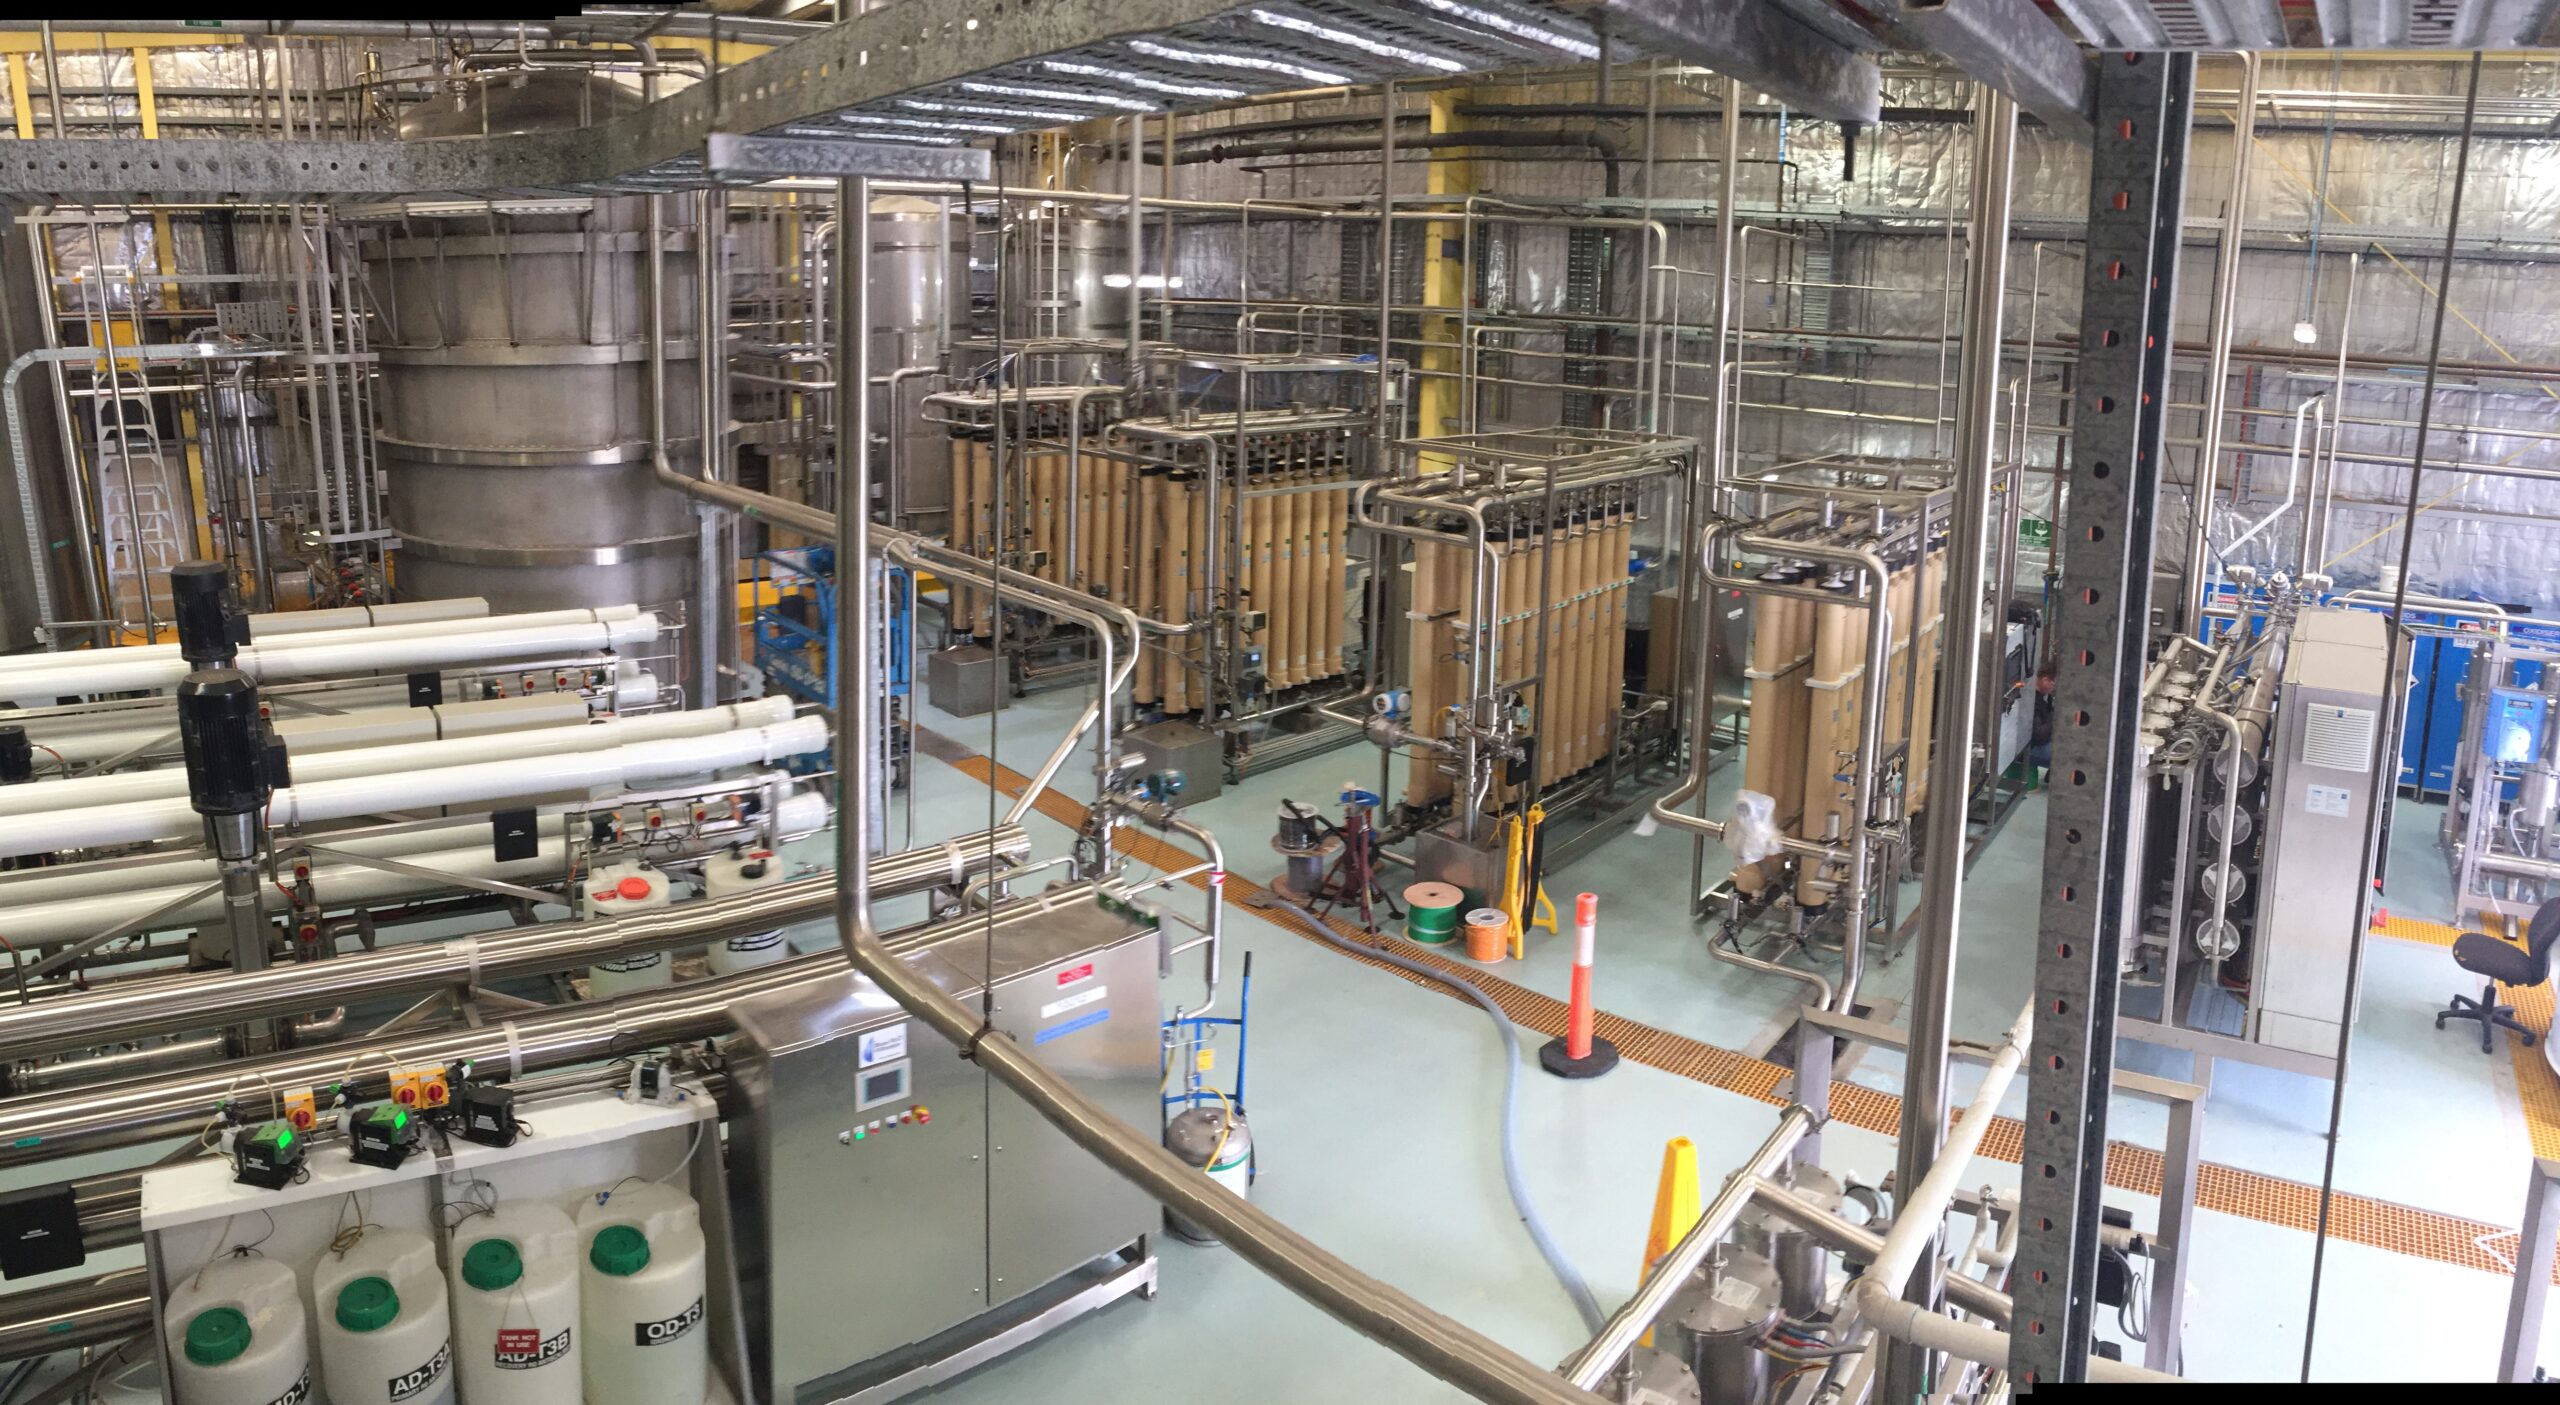
More fundamentally, at around 15 ppm hardness this water does not need softening. Softening is not wrong in principle, but a low dose of antiscalant controls scale entirely on this chemistry. BHF have a number of reference systems on this water type. The most significant is a large biotechnology facility in Melbourne, where four large independent systems all operate at 90% recovery behind ultrafiltration, none of them with a softener.
The summary was uncomfortable
| Component | Intended function | Finding |
| Multimedia filter | Particulate removal | Almost useless for its purpose here; less than 1% of the load is in its range |
| Activated carbon | Dechlorination | Too small for the application; gives rise to biofilm growth, and fouls the downstream softener and RO |
| Softener | Hardness removal | Undersized for the required feed flow, with heavy biofilm in the brine tank, and not required at all on this water chemistry |
Three components, maintained and serviced in good faith, none of them earning its place.
The alternative
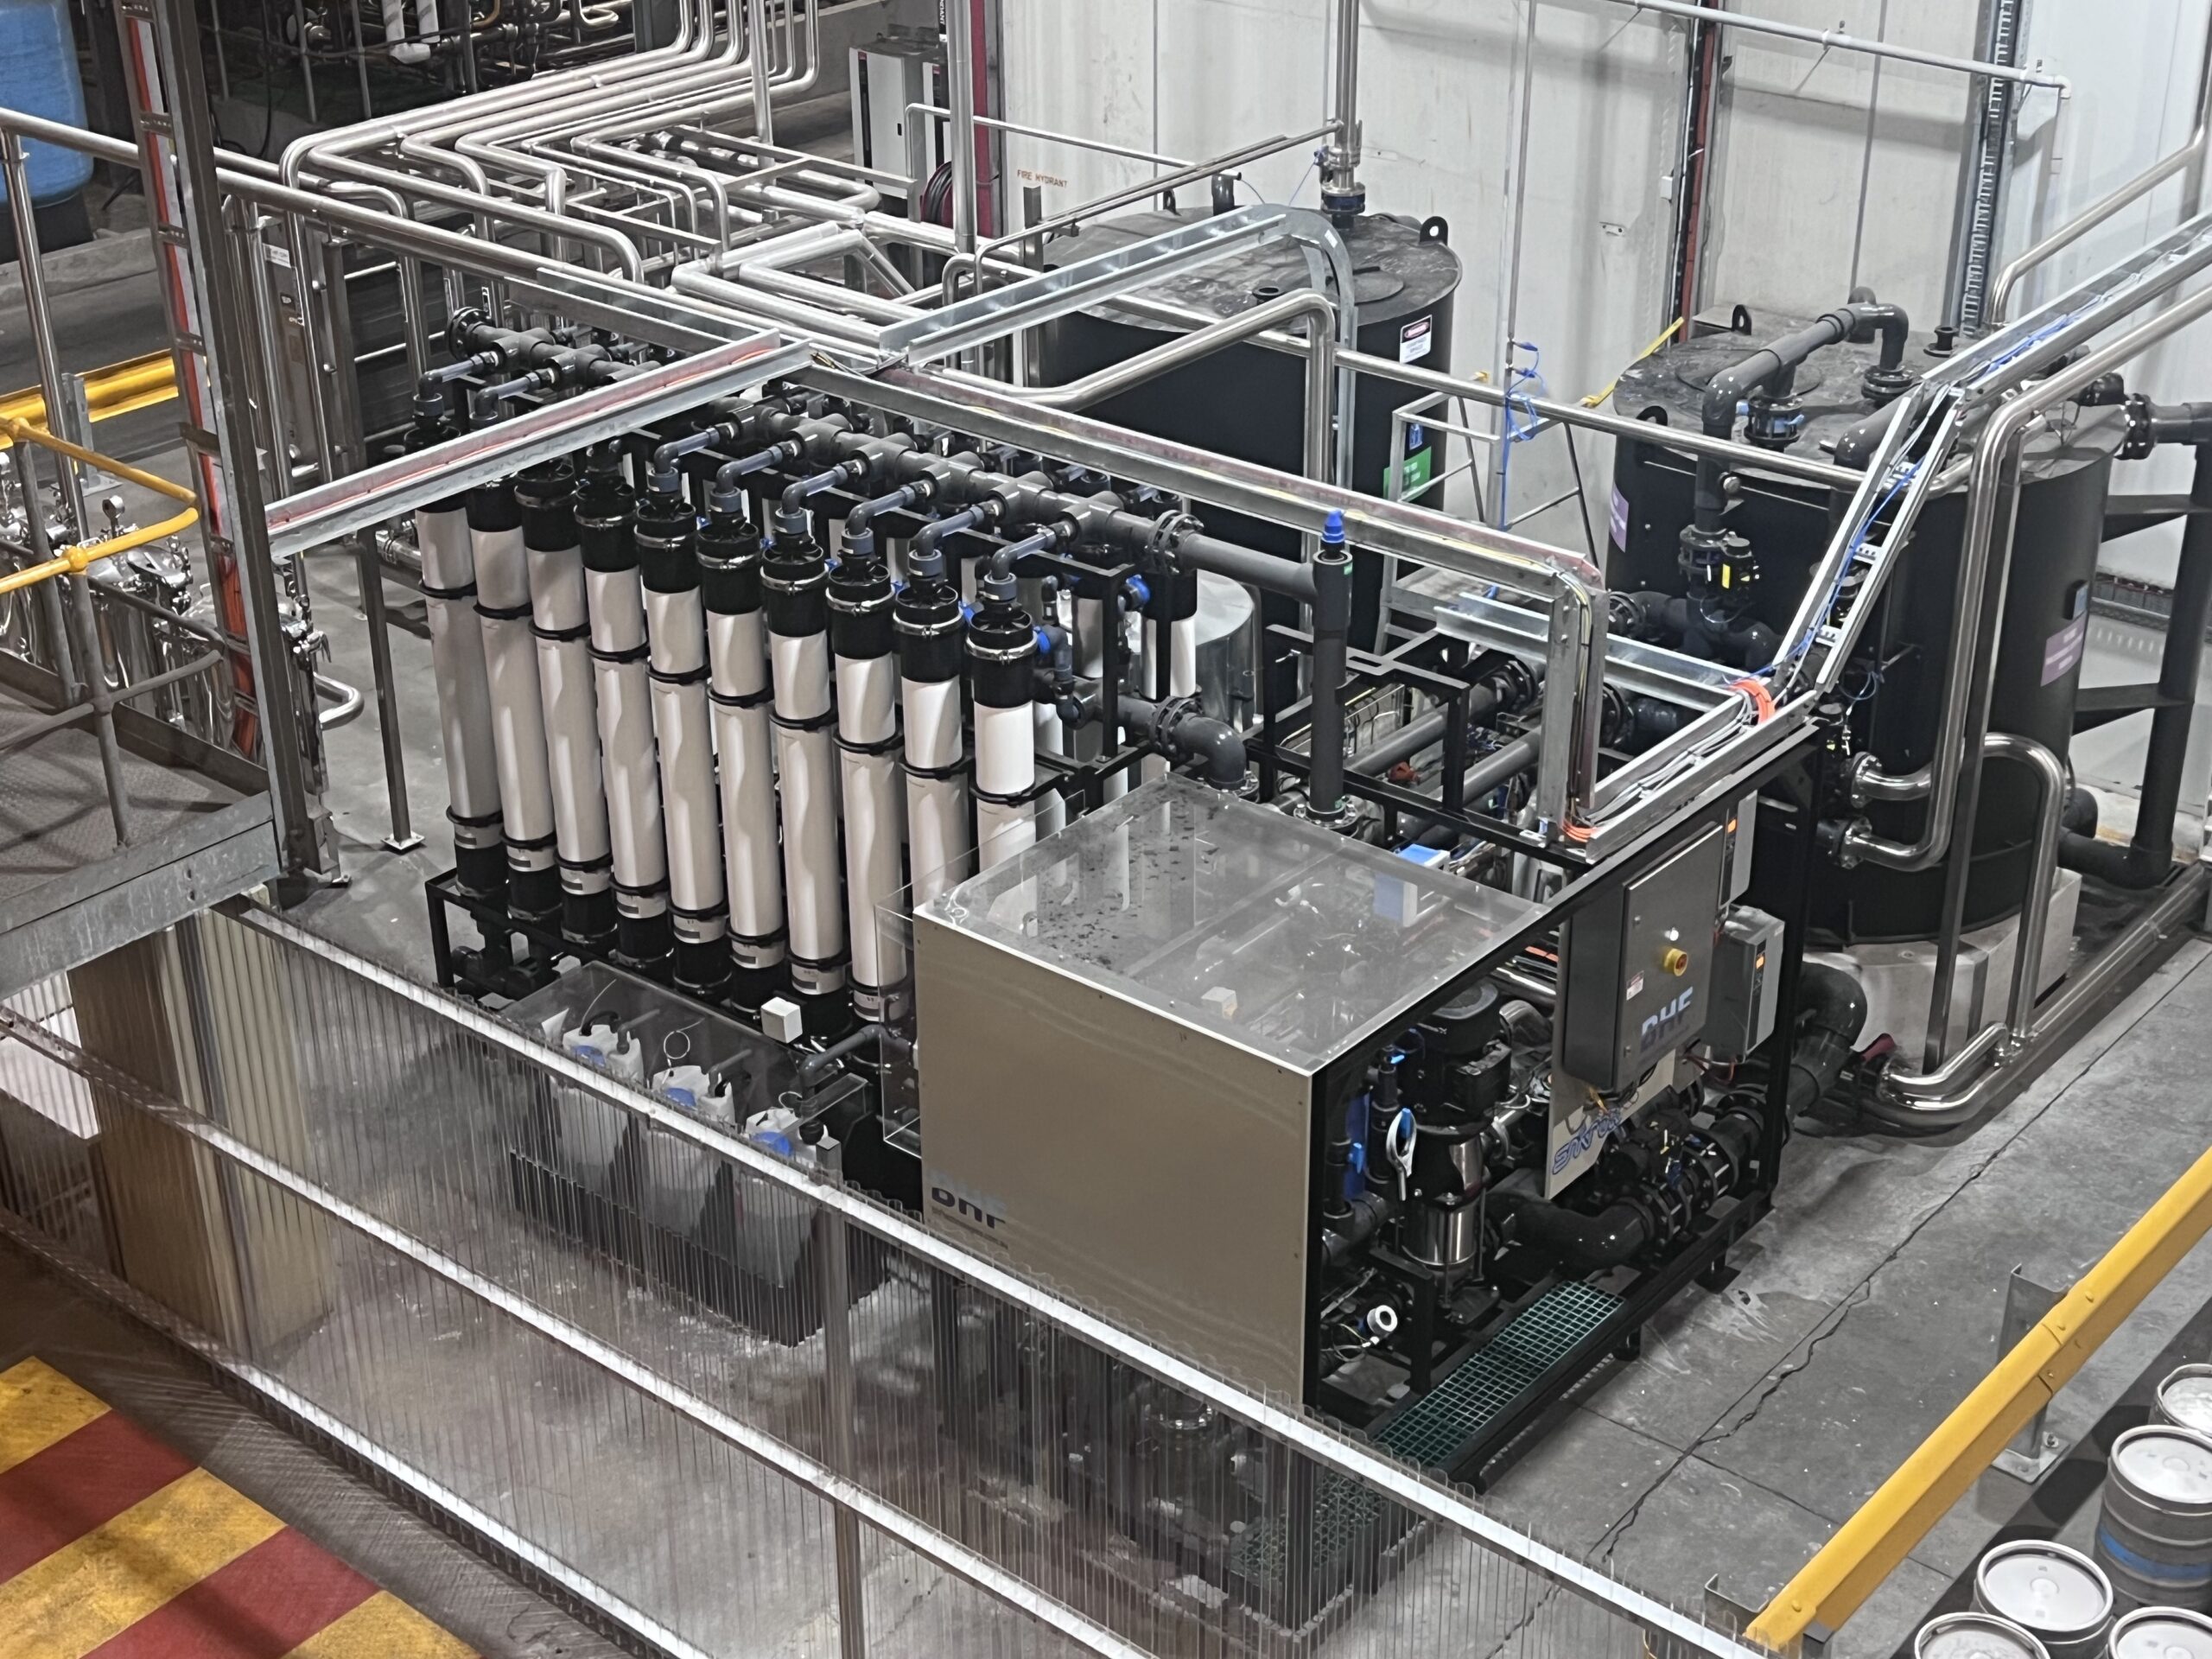
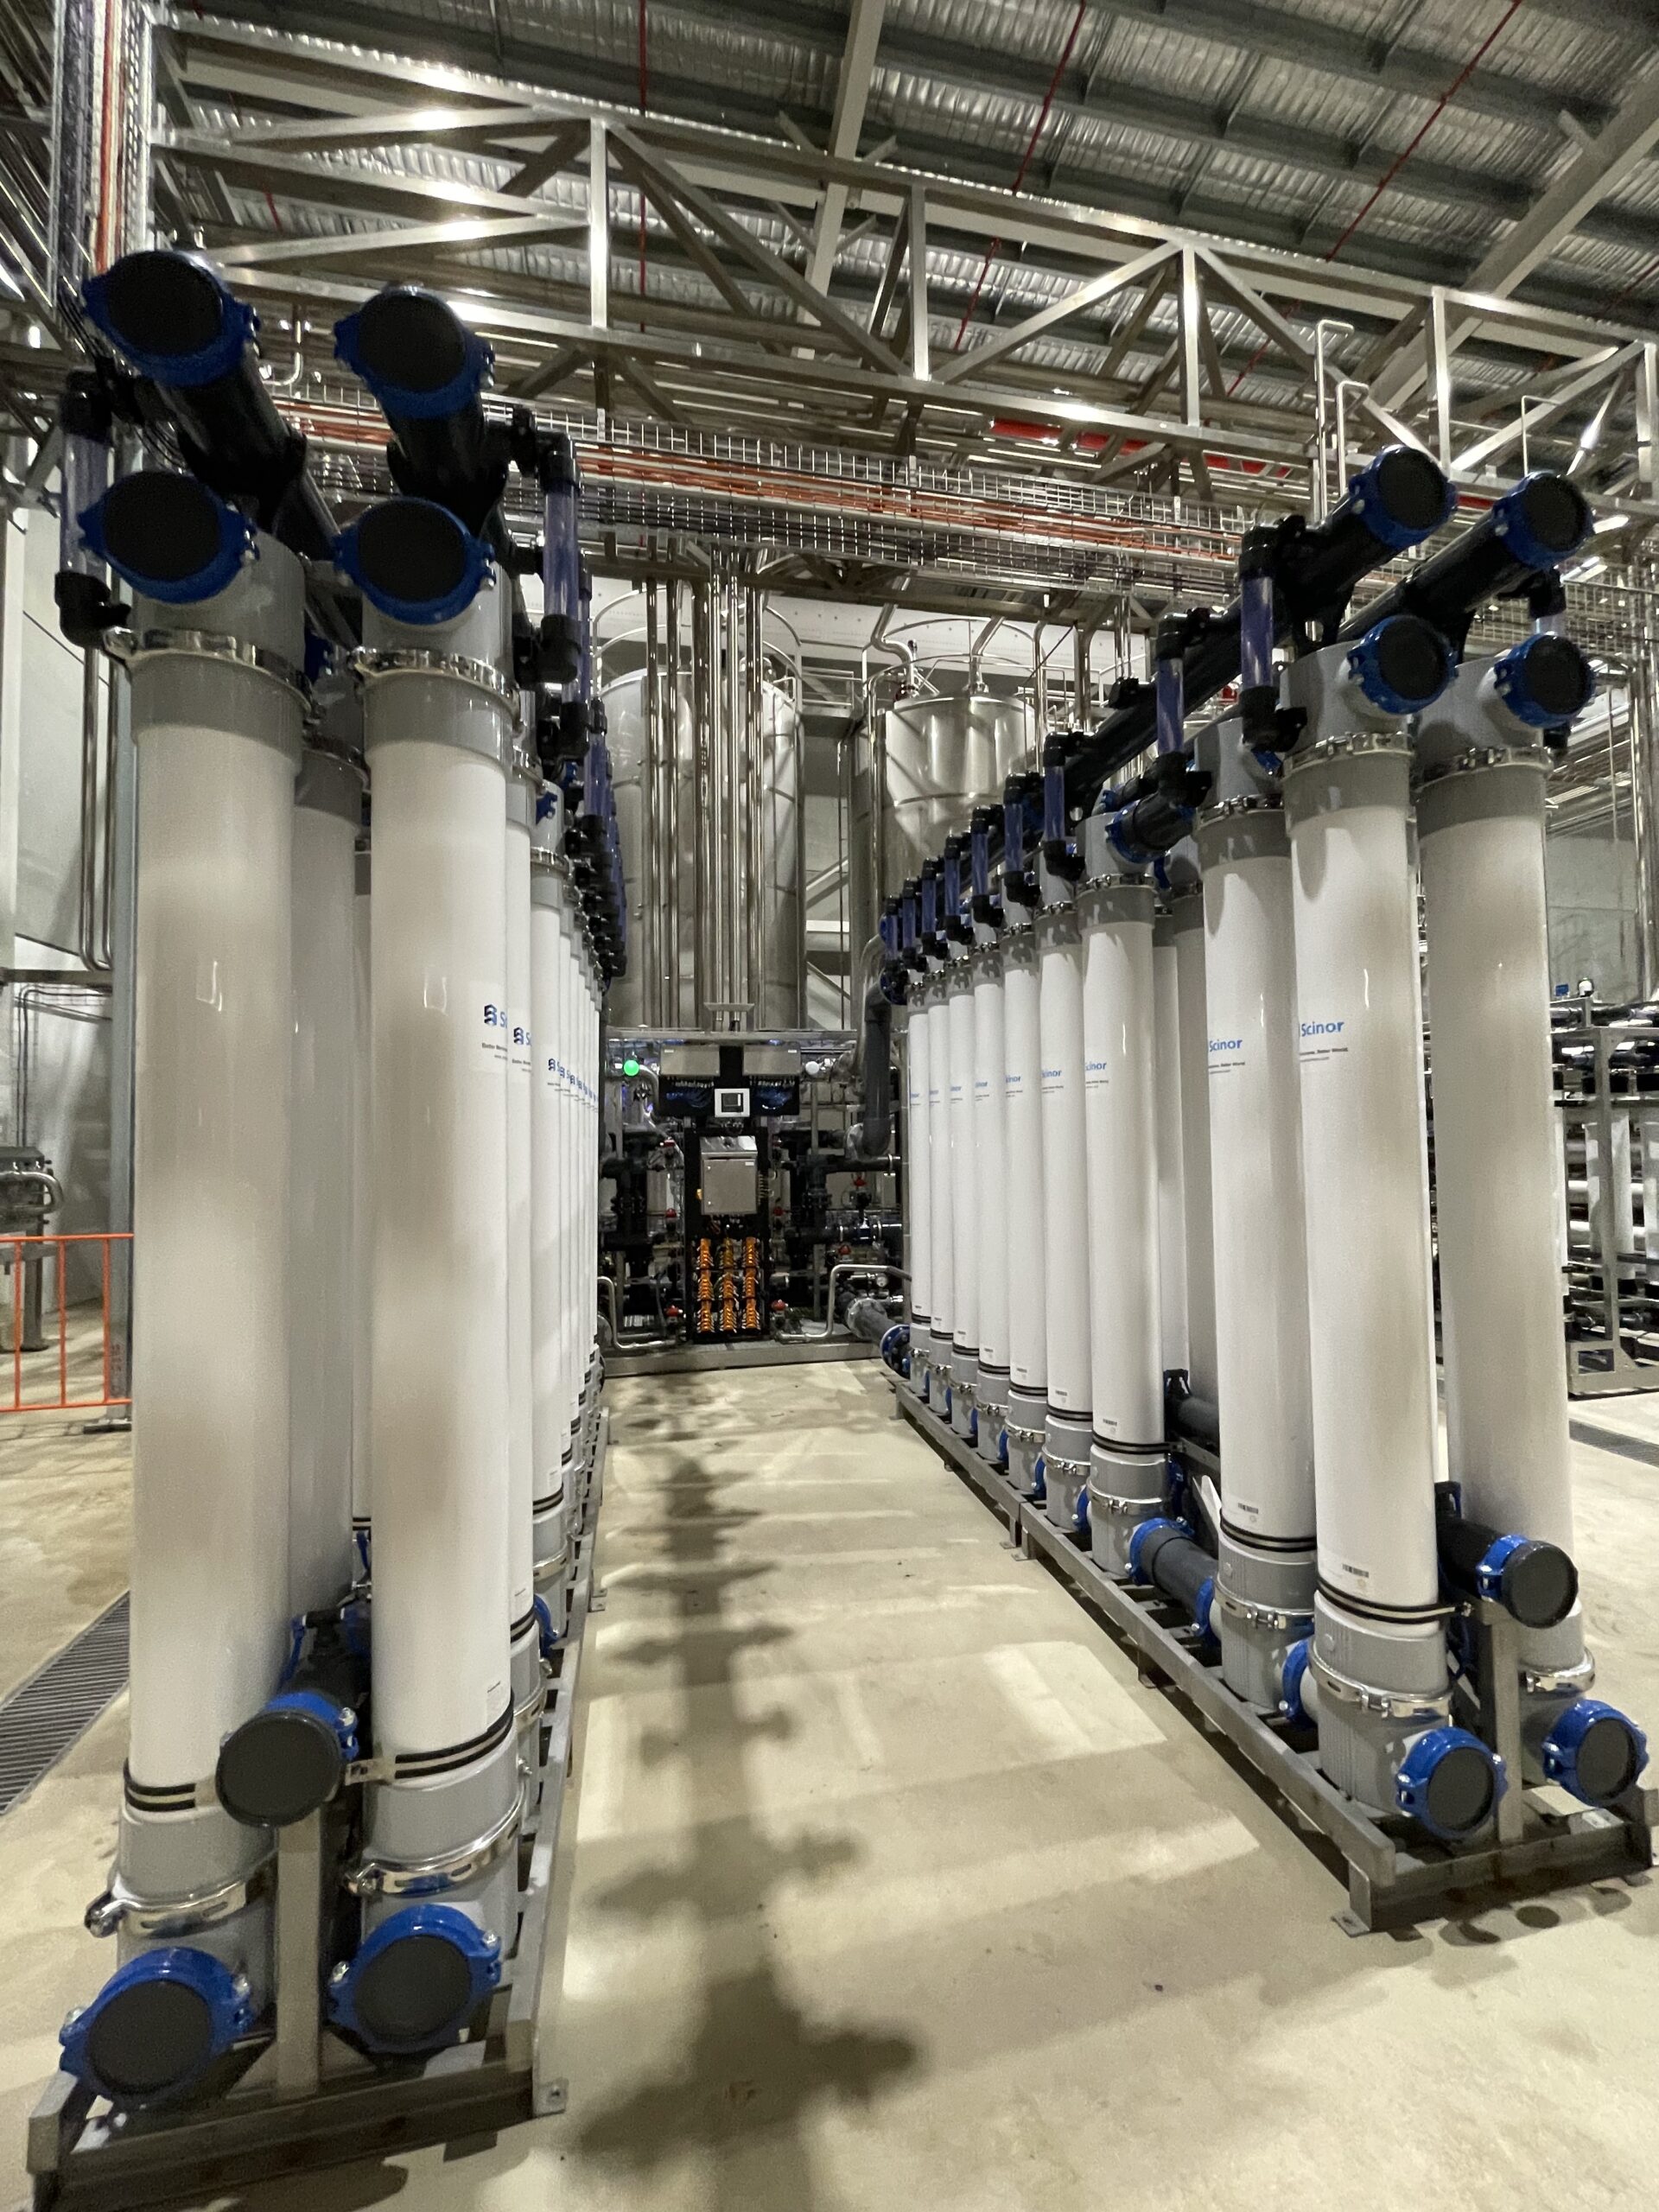
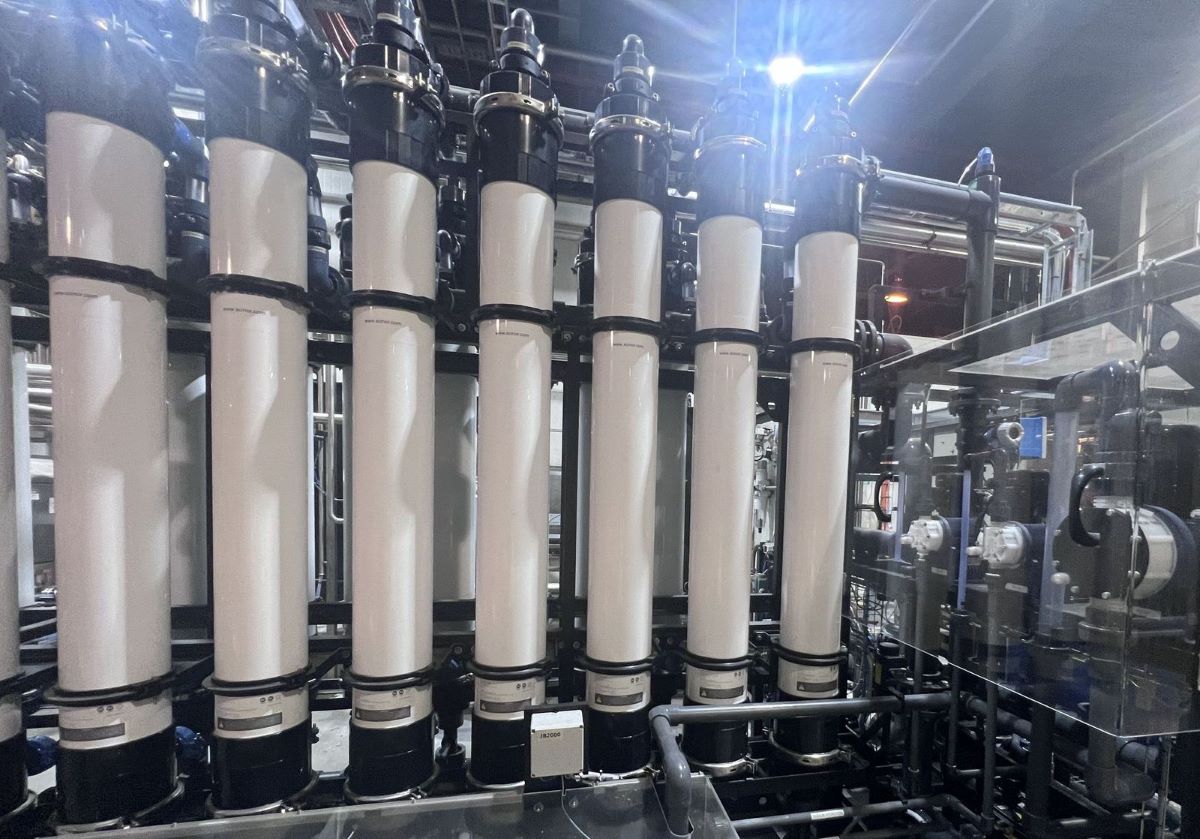
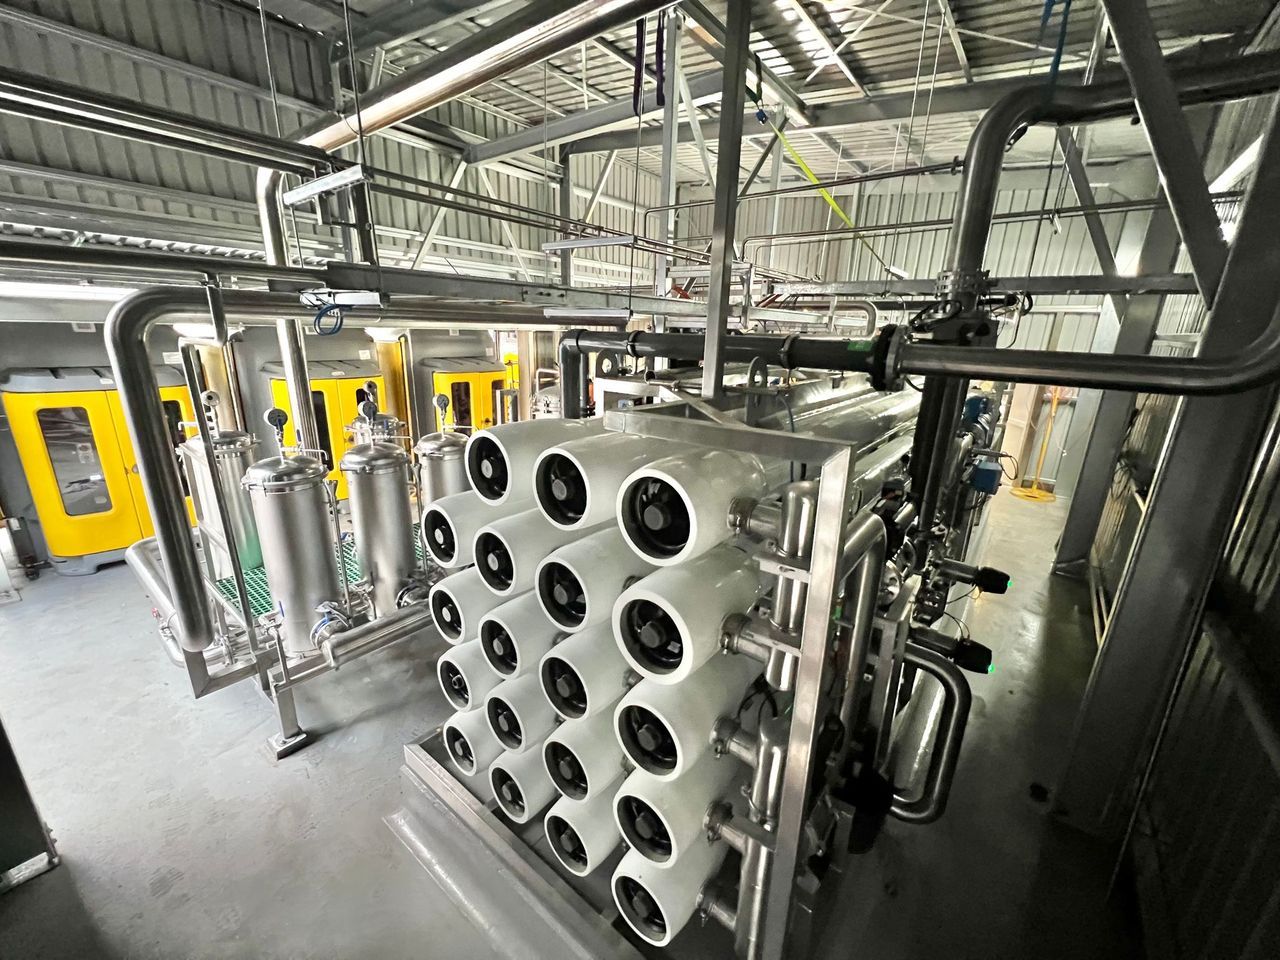
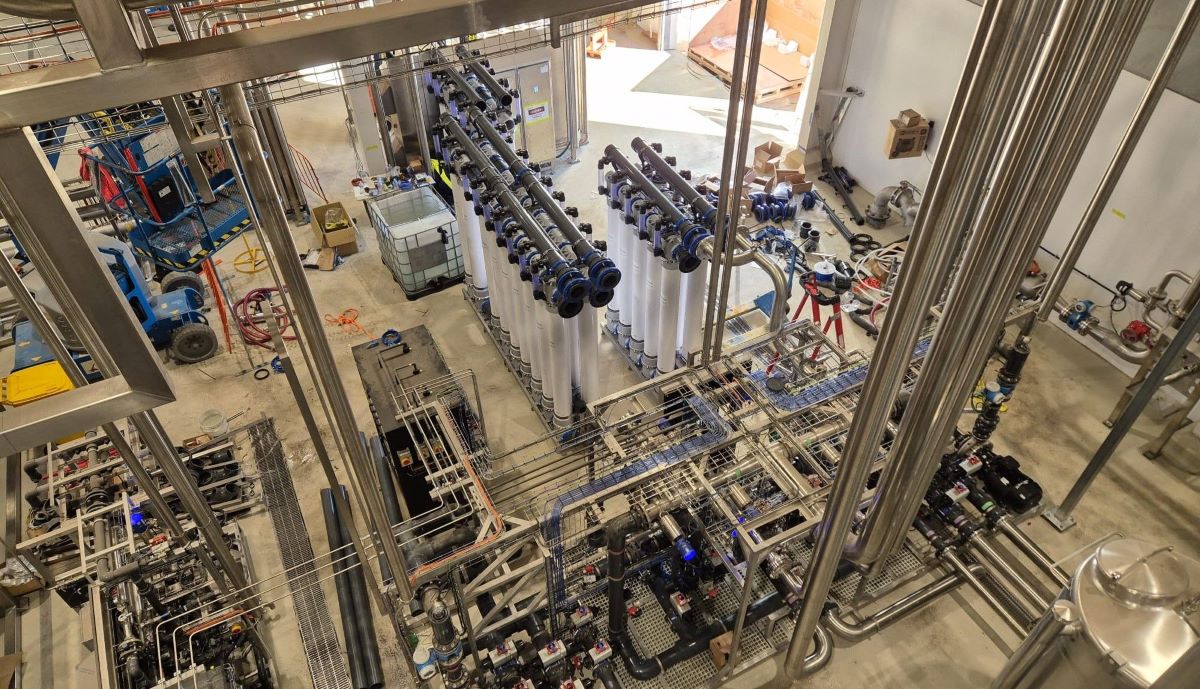
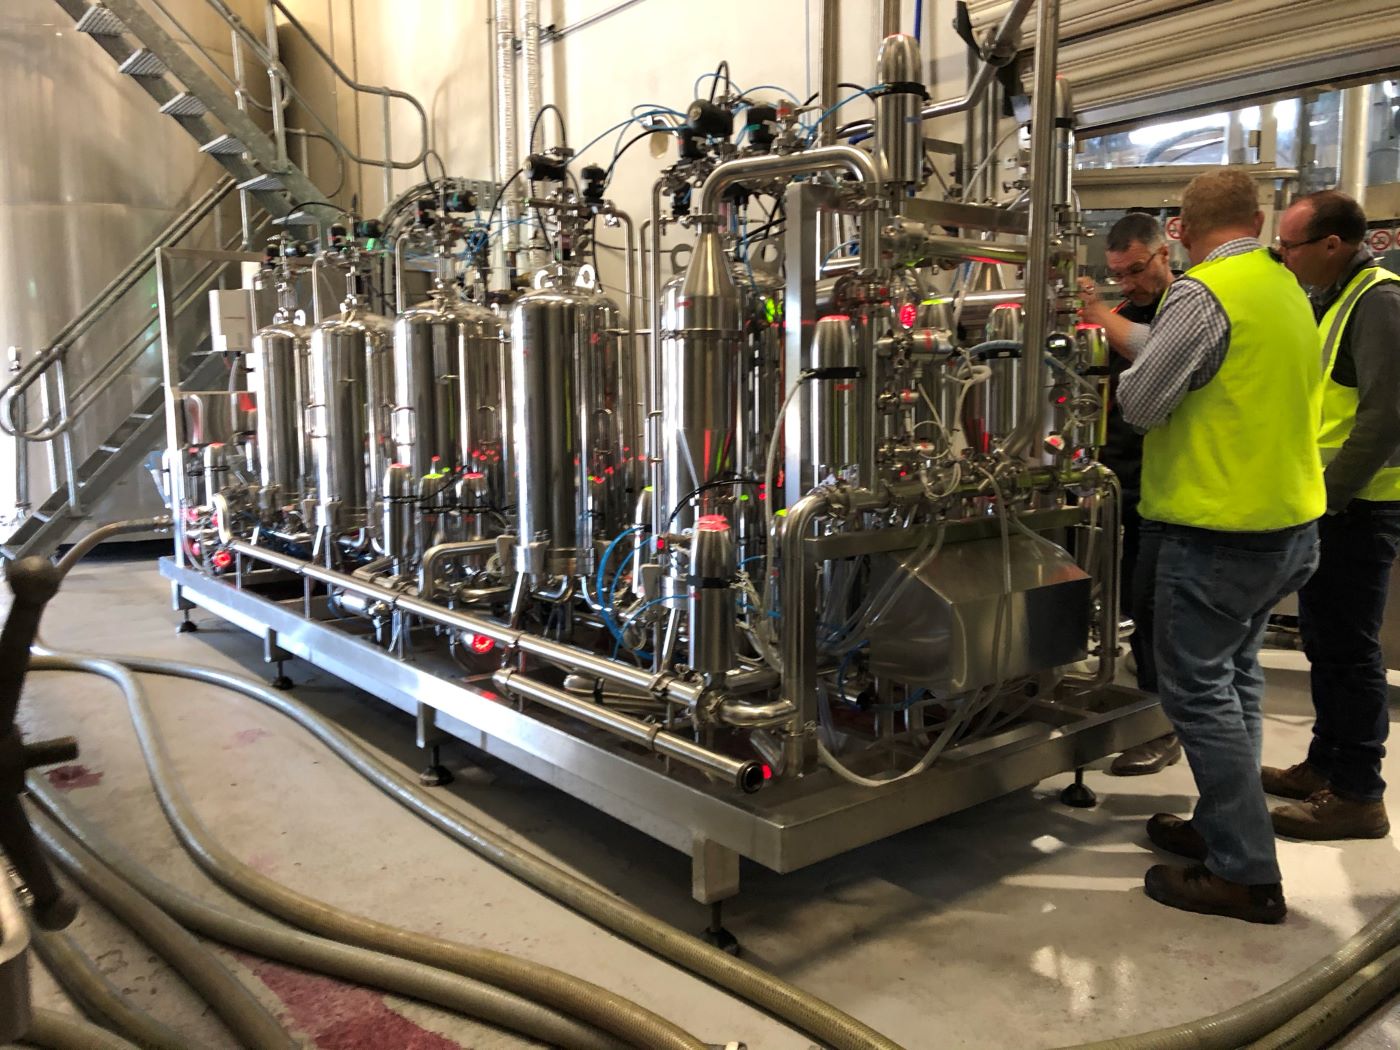
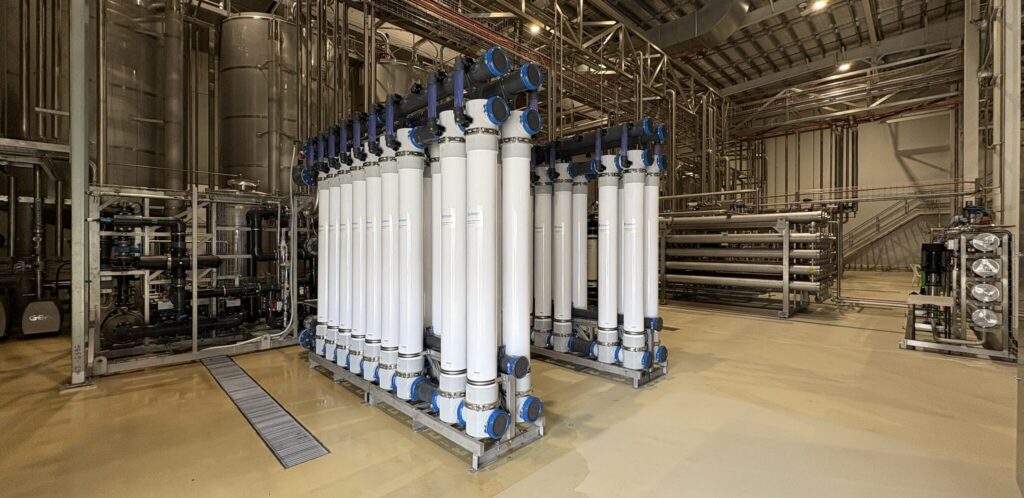
Without going into detailed design, the cost-effective solution over a three to five year horizon is an ultrafiltration membrane system feeding a two-stage dosing skid: SBS for free chlorine, and antiscalant for scale. It is one that delivers a reliable pretreated feedwater so the RO can reliably produce its 1 µS/cm permeate, with low service and cleaning cost and long membrane life.
That replaces all three existing components. Scale control moves entirely to antiscalant rather than softening.
The detailed design of the dosing assemblies is a separate conversation. In summary they consume very little of either chemical, so the running cost is low, and they carry none of the problems that come with carbon and softening vessels. Chief among those is the insufficient flow that starves and fouls the RO, which no amount of servicing a vessel will fix.
Why ultrafiltration
- It filters what is actually there. UF removes to approximately 0.03 µm, capturing the sub-micron colloidal fraction that actually constitutes this feedwater’s fouling load, and which nothing in the existing train addressed.
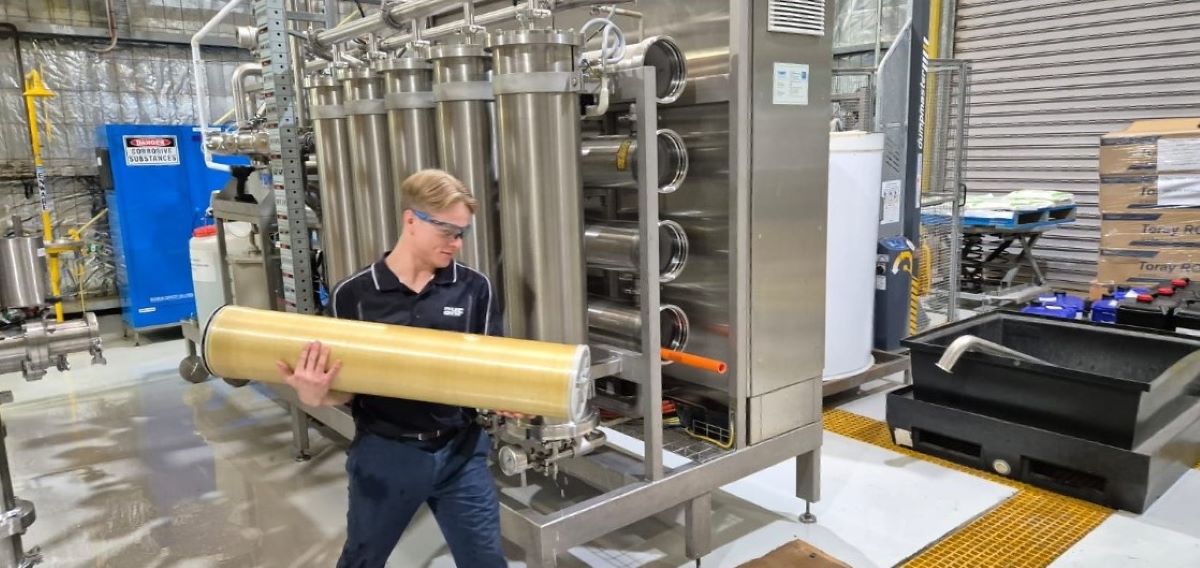
- It is not a consumable. The membranes clean automatically and last up to ten years before replacement. The consumable burden of fine cartridge filtration disappears, and the operating cost over the life of the plant is very low.
- It removes the food supply. Its tight structure removes much of the colloidal organic load. Those organics are nutrient for microbial growth within the system, which fouls RO membranes and, in hygienic or sterilising-grade applications, can compromise the purified water specification itself.
- It pays for its own waste. UF has a waste component of around 5%, but it enables up to 90% RO recovery. That is a very favourable trade against the waste it costs.
What the feedwater to the RO becomes
| Parameter | Before | After |
| Fouling index | 75% blockage in 5 minutes | SDI < 1 |
| Free chlorine | Present | < 0.1 ppm |
| Scale control | Softening: undersized, contaminated | Antiscalant dosing, total |
| Colloidal and organic load | Very high, >99% sub-micron | Removed to ~0.03 µm |
And what that should deliver
| Measure | As found | After |
| RO output | Baseline | +30% |
| Total plant water recovery | 60% | 85 to 90% |
| Cleaning and service interval | Monthly | 3-monthly |
| RO prefilter change | 2-weekly | 6-monthly |
| RO membrane life | ~1 year | Up to 5 years |
| UF membrane life | n/a | Up to 10 years |
| Permeate | Variable | ≤1 µS/cm, tight microbiological specification |
Projected for this plant, from measured performance on comparable systems. Recovery is a total plant figure and already accounts for the UF waste stream. On top of it sits the backwash and regeneration wastewater previously lost from the multimedia, carbon and softening systems, recovered by removing the components that produced it.
Put per litre of product: at 60% recovery, making 100 litres of purified water discharges 67 litres to drain. At 85 to 90%, the same 100 litres discharges 11 to 18, somewhere between three quarters and five sixths less wastewater, before counting the backwash streams that disappear with the old plant.
| Total plant recovery | Purified water made | Discharged to drain |
| 60% (as found) | 100 litres | 67 litres |
| 85 to 90% (after) | 100 litres | 11 to 18 litres |
Is it worth it?
The honest answer is that the flow correction was nearly free and paid immediately. The pretreatment replacement is a capital decision, and it earns its return over three to five years through consumables, service labour, membrane life, wastewater charges and (often the largest item, and the hardest to put a number on) a plant that consistently meets its specification instead of occasionally missing it.
For context on what that return is built from: on this water without the right pretreatment, RO membrane life is typically around one year. The five-year figure is not a projection. It is measured on the reference systems above, four large independent systems at a Melbourne biotechnology facility, all running at 90% recovery behind ultrafiltration. The UF membranes doing the protecting last up to ten years.
If this sounds like your plant
| Surface water supply with high colloidal or organic content. An off-the-shelf pretreatment package specified generically rather than to your water. Low feed hardness, with a softener carried as a cost anyway. A plant modified since commissioning, where flows have drifted from design. High cartridge filter consumption and short membrane life, accepted as normal. |
None of those on its own proves anything. Together they usually mean there is recovery sitting in the plant that nobody has gone looking for.
Talk to us
A water plant audit establishes your baseline flows and pressures, compares them against design, and tells you what your plant is actually capable of before anyone quotes you for equipment. To arrange one, contact our team through our enquiry form.
Frequently Asked Questions
Not as a first step. On this plant, minor pipework modifications that rebalanced the flows to design removed the self-inflicted fouling and showed the plant was capable of far more than its 60% recovery, without any new plant being purchased. The pretreatment then has to be checked to make sure it can sustain that.
On this water chemistry, at around 15 ppm hardness, softening is not required. A low dose of antiscalant controls scale entirely on this chemistry, and BHF’s reference systems on this water type run at 90% recovery behind ultrafiltration with no softener.
Yes, around 5%, but it enables up to 90% RO recovery. The projected 85 to 90% total plant recovery already accounts for the UF waste stream, and the backwash and regeneration waste from the multimedia, carbon and softening systems disappears with those components.