


Understanding Filterability Index
August 26, 2024
Although it is common for wine packaging facilities to measure NTU in order to evaluate wine suitability for particular filtration grades, not all measure filterability index (FI). Part of the reason for this lies in the commonly-held falsity that NTU correlates with FI, but also perhaps because filterability is not a topic currently taught to winemakers in our education system. NTU is a measurement of light scattering in a sample, and so provides an approximation of particulate loading. The measurement of NTU cannot, however, provide an indication of wine colloidal status, hence the situation can arise where a very clean wine with low NTU can still foul filtration media, as was extensively observed for 2011 South Australian reds. Filterability index determination is a direct challenge of the wine to be filtered to the membrane, and so provides an indication of all fouling components in the sample, whether particulate or colloidal. We have published previously on this topic (Bowyer, Edwards & Eyre, 2012; Bowyer, Edwards & Eyre, 2013) and here provide the most recent developments in our understanding of this rather complex topic.
FI Measurement
The measurement of FI is quite straightforward, nevertheless many laboratories avoid this measurement since, without appropriate methods and equipment, it can be cumbersome and time consuming for laboratory staff. There are several different methods for determining filterability. Some are quite complex and some are relatively simple. One universal fact is that if the method and equipment used are not simple and easy to work with, this measurement is often neglected and viewed only as an annoyance.
The method that we advocate is perhaps the simplest. A sample is delivered to a membrane disc at a constant 2 bar, with the time recorded to pass 200 and 400mL (or g, in the case of the BHF automated FI unit). A simple calculation (Bowyer, Edwards & Eyre, 2012) provides the filterability index as indicated in equation 1:
FI = T400 – 2T200 (1)
Any fouling of the membrane slows the flow of sample, increasing T400, and so when the formula is applied an index is generated. Sometimes a constant of 1.67 is applied but, since it is a constant, it can be omitted. The assay can be performed manually, but it is far easier to use an automated unit (Bowyer, Edwards & Eyre, 2012). Critically, the membrane discs used for FI determination should be the same as those membranes used at bottling. This is sometimes overlooked, but a comparison of relative membrane performances reveals the importance of this simple point (see below).
The measurement of FI provides an evaluation of the fouling that is likely to occur during bottling, however it is not a replication of the bottling filtration process. Typically, a sterile bottling task will see the wine pass through tight lenticular (depth) onto 0.65 um membrane pre-filters onto 0.45 um final membranes. There are several permutations of this configuration, but this is the most commonly used. FI measurement does not replicate this process, since no pre-filtration is applied before the measurement. Wine destined for sterile filtration must be within specification (e.g. < 1 NTU) before it is accepted, in which case minimal loading should be applied to any of the sequenced filters, yet this is not always the case. FI measurement is used to detect problem wines, specifically those that will cause unacceptable loading of the final membranes, and represents a way of avoiding both production delays for the packager and elevated filtration costs for the customer. These wines are typically found to have low NTU and high FI. We generally advise an FI threshold of 20 sec.
Colloids
There are two types of colloids found in wine: associative colloids and macromolecular colloids. Association colloids are aggregates of small molecules, driven to associate through weak intermolecular forces such as van der Waal’s forces, hydrogen bonding and hydrophobic interactions (Bowyer, 2003), and are typically produced by fining processes. Macromolecular colloids are comprised of one major species, such as polysaccharides, proteins, mannoproteins, carboxymethylcellulose (CMC) etc. Generally these compounds possess a molecular charge, and they can be used to stabilise association colloids, an example of which would be the addition of gum arabic to stabilise pigmentation in reds. Colloids can present a problem for filtration in that, unless the colloid is of sufficient size to be observed by NTU, it lies latent and undetected in the wine until it is pushed through a membrane, at which point it can cause fouling. Since filterability measurement employs the membrane filtration process, the true filterability nature of a wine sample can be discerned.
In some cases wines have been ultrafiltered (cross-flow) and pass FI testing, only to fail a retest within a relatively short time period. We speculate that examples of this type demonstrate the impact of associative colloids, which are likely to be disrupted during ultrafiltration through the application of shear forces, enabling a pass during FI measurement, but which then reassociate in short time to once again provide a mechanism for fouling membranes.
The impact of macromolecular colloids on FI is more straightforward, as FI can be measured pre- and post-addition to determine filterability impact. In some cases a transient elevation of FI can be observed, such as with the application of CMC (Bowyer, Edwards & Eyre, 2013).
FI and FIm
Occasionally wines are found that pass FI but present a differential pressure increase across the membrane during bottling at a faster than expected rate, so what is going on here?
The basic measurement of FI (Equation 1) gives a filterability snapshot of the wine up to 400 mL, but this has a limitation in that it is a small measurement (0 – 400 mL) and we are seeking to extrapolate this FI value to the filtration of a large volume of wine with filters of a much greater surface area. We have found that by extending the measurement to 600 mL and using 3 data points, as in Equation 2, to calculate a modified filterability index (FIm), a better understanding of the wine impact on the filtration membrane is possible.
FIm = (T600 – T200) – 2(T400 – T200) (2)
In many cases, FI and FIm are very similar values, indicating that over time the sample is unlikely to have a deleterious effect on the filtration performance, but on occasion the two values are sufficiently different in magnitude to raise some suspicions. It may even be that FI represents a pass value (typically < 20), but FIm does not. Since FIm better reflects membrane performance over time, perhaps we should be giving this value proportionately more weight when evaluating the filterability of a sample.
In Table 1 we can see two data sets for the same wine, a 2012 Malbec, which has been filtered through different grades of Becopad. The filtration grades are the same in each case except for the final grade applied, with 170 being tighter than 220 (see data in the caption to Table 1). In this example, the value of the tighter 170 grade as the final filtration stage becomes obvious when one examines the FI and FIm data: with tighter final filtration these values are almost identical, but with a slightly looser grade of final filtration FIm becomes significantly greater than FI, indicating that this wine would load the 0.45 um membrane to a much greater extent than the previous wine, and may cause premature blockage.
| FI | FIm | |
| 2012 Malbec post Becopad 580/450/170 | 7.80 | 7.24 |
| 2012 Malbec post Becopad 580/450/220 | 12.0 | 34.9 |
Table 1: FI and FIm data for a 2012 Malbec with different filtration grades applied in sequence. Becopad 580: Nominal 3.0 – 4.0 um; Becopad 450: Nominal 1.0 – 2.0 um; Becopad 220: Nominal 0.3 – 0.5 um; Becopad 170: Nominal 0.2 – 0.4 um.
In conjunction with this, there is a strong advantage in using an automated FI unit, such as the BHF-supplied units at all Vinpac facilities, in terms of ease of use and laboratory time allocation, and also in that a real-time plot of the filterability curve is generated by the software during the measurement. A sample report is easily generated that can be provided to the customer to help them understand the filterability status of their wine. The filterability plot also allows closer scrutiny of the membrane performance during a filtration run, and this is not evident when using a manual unit since only a single numerical value is obtained, constituting only a pass or fail result. If we examine the plots from the wines used in Table 1, the difference between them becomes immediately obvious (Figure 1). The influence of the tighter filtration applied through the Becopad 170 is clearly evident through both the greater linearity of the plot and the faster flow rate, in addition to the similarity of the FI (7.80) and FIm (7.24) values. The tailing evident in the plot for the wine filtered through Becopad 220 indicates higher membrane loading, which is also reflected in the greater disparity between FI (12.0) and FIm (34.9).
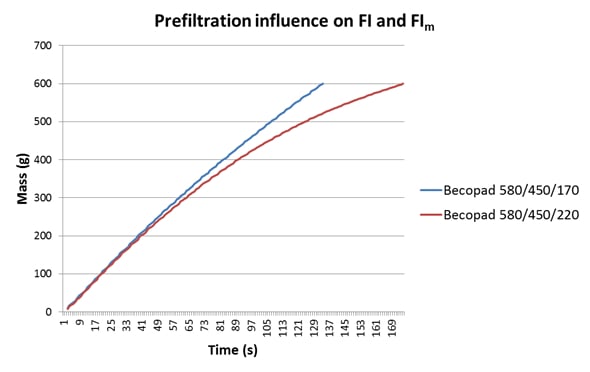
Figure 1: A comparison of the FI plots for the wines from Table 1.
Relative Performances of Media Types
Some laboratories not only use different methods for FI analysis, but also different membrane discs, disc sizes (25mm or 47mm) and porosities. For example, some laboratories use cellulose acetate discs in either 0.45μm or 0.65μm, yet very few wine membranes are made of this material. Some facilities measure FI using nylon membrane discs in either 0.45μm or 0.65μm, but use polyethersulfone (PES) wine membranes at bottling. There is no specific standard for FI analysis at this stage, so it is not possible to transpose data obtained from two different sources.
The main common element in Australia in terms of sterile filtration is that 0.45μm final membranes are used, and increasingly PES is gaining prominence over nylon as the material of choice. The differences between the performances of nylon and PES membranes is quite significant, in terms of membrane symmetry, colour binding, FI data obtained, membrane loading capacity and flow rates (Bowyer, Edwards & Eyre, 2013). To demonstrate this, a sample of RO water was analysed, the data for which are presented in Table 2 and Figure 2. The significantly decreased flow rate of the nylon disc is a result of both the membrane composition and symmetry (Bowyer, Edwards & Eyre, 2013).
| Membrane Material | FI | FIm | Test Duration(s) | |
| RO Water | Nylon 0.45μm | 4.6 | 0.6 | 178 |
| RO Water | PES 0.45μm | 0.0 | 0.0 | 59 |
Table 2: FI and FIm data for RO water passing through nylon and Parker-Domnick Hunter PES 0.45μm discs.
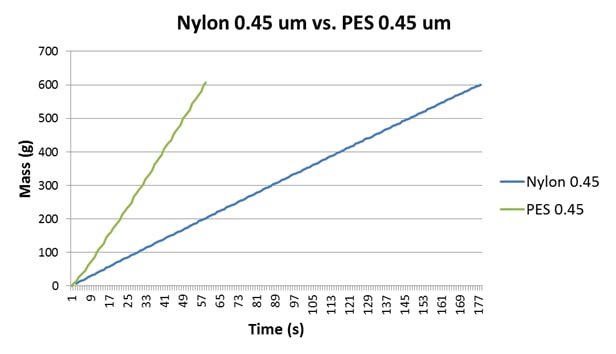
Figure 2: A comparison of the FI plots for RO water using nylon 0.45μm and a Parker-domnick hunter PES 0.45μm disc. Both membranes generate quite linear plots but exhibit different flow rates and FI data.
In a similar way, cellulose acetate (or “ester”) discs are commonplace in laboratories, and are often used for cell counts on growth media, although their use for generating FI data is debatable given that most wine membranes are either PES or nylon. In Table 3 and Figure 3 we can see data for a wine analysed using 0.65μm cellulose acetate discs (as was laboratory practice at the site in question) and PES 0.45μm discs (which was the membrane type in the bottling hall filters). The 0.65μm cellulose acetate discs, having the greater porosity, allow a greater flow rate than the 0.45μm PES discs, and even though the FI data obtained are similar the FIm data are quite different. The discrepancy is perhaps more obvious in the FI plots depicted in Figure 3.
| Membrane Material | FI | FIm | Test Duration(s) | |
| 2013 Shiraz | Cellulose acetate 0.65μm | 4.3 | 27.2 | 104 |
| 2013 Shiraz | PES 0.45μm | 4.7 | 2.4 | 131 |
Table 3: FI and FIm data for a 2013 Shiraz analysed using 0.65μm cellulose acetate and 0.45μm Parker-Domnick Hunter PES discs. Note the large difference in FI and FIm data for the cellulose acetate disc.
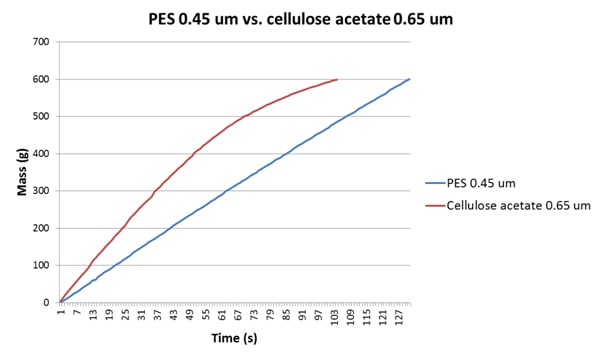
Figure 3: A comparison of the FI plots for a 2013 Shiraz using a cellulose acetate 0.65μm disc and a Parker-domnick hunter PES 0.45μm disc. The flux characteristics here are quite different, with the cellulose acetate membrane leading to significant tailing, which in turn elevates FIm.
Conclusion
There is, as yet, no specific standard for filterability analysis in terms of method applied, membrane disc size and membrane composition. These parameters can influence filterability analysis outcomes, and this should be borne in mind before seeking to draw comparisons between data sets. Our advice is to use 25mm membrane discs for filterability analysis that are identical to the final wine membranes in terms of porosity and composition. In this way filterability information of the greatest value can be used to make judgements regarding wine impact on membranes during sterile filtration.
Paul K. Bowyer and Greg Edwards
Dr Paul Bowyer is the Regional Manager (SA/WA & SIHA) for BHF Technologies. Greg Edwards is the Group Technical Manager for Vinpac Angaston.
BHF wishes to thank The Australian and New Zealand Grapegrower and Winemaker for permission to reproduce this article. Subscription information can be found here.